
Multifamily Utility Billing KPIs: A Nine-Metric Scorecard
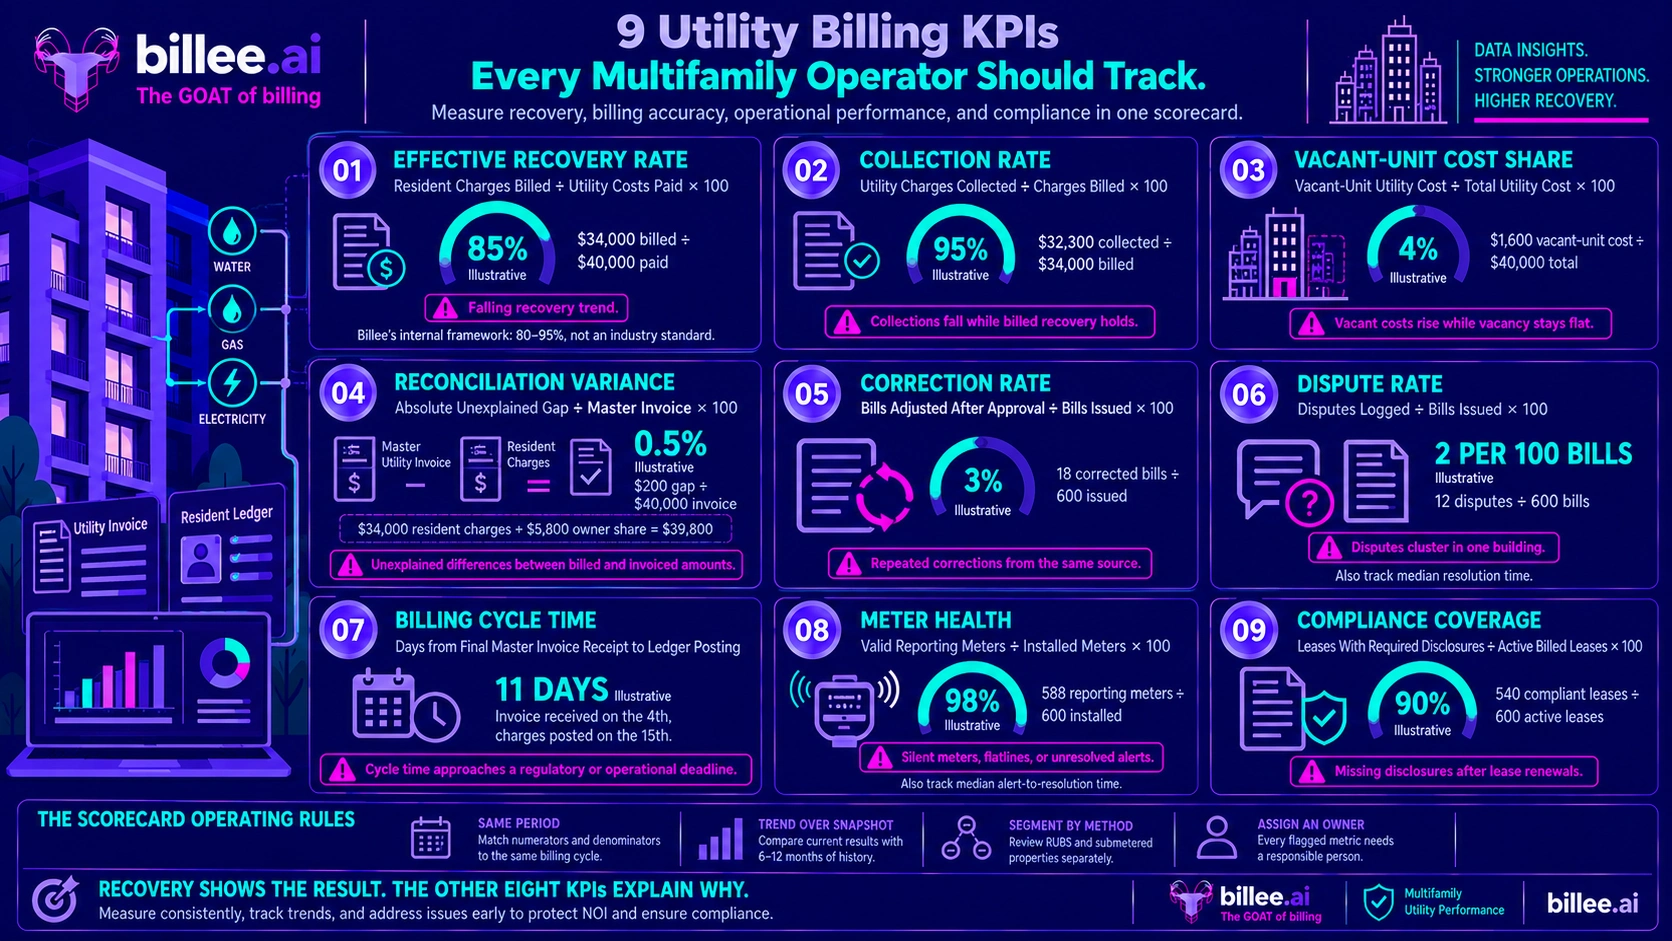
Nine KPIs cover multifamily utility billing: effective recovery rate, collection rate, vacant-unit cost share, reconciliation variance, correction rate, dispute rate, cycle time, meter health and compliance coverage. Each needs a formula, a same-period data source, a trend line and a named owner. Billee Technologies, Inc. supplies portal reports and a dedicated team behind several of them.
Most operators watch one number: recovery. Recovery is a result, not a cause. Eight other numbers explain why it moves, and several of them show a problem a full cycle earlier. This scorecard uses definitions and formulas only. It sets no outside benchmarks, so thresholds should come from your own trailing six to twelve months, except where a rule sets the line.
Key takeaways
- Track recovery, collections, vacant-unit cost, reconciliation, corrections, disputes, cycle time, meter health and lease coverage. Together they separate billing problems from payment problems.
- Compare every ratio over the same billing period. A bill for May against an invoice for April produces noise.
- Trend beats snapshot. A three-point drop deserves more attention than a steady 88%.
- Segment RUBS and submetered properties. Their numbers behave differently.
- Billee's 80–95% effective recovery range is Billee's own framework, not an industry standard.
- Rules turn some KPIs into compliance checks, including Maryland's written disclosures, Virginia's 15-day bill deadline for electric and gas submetering and D.C.'s vacant-unit limit from Jan. 1, 2027.
The nine KPIs at a glance
KPIFormulaCadenceWhere the data livesWarning signEffective recovery rateBilled to residents ÷ paid to vendorsMonthlyBilling platform; vendor invoicesFalling trendCollection rateCollected ÷ billedMonthlyPMS resident ledgerFalls while recovery holdsVacant-unit cost shareVacant-unit cost ÷ total utility costMonthlyMeter reads; occupancy dataRising with vacancy flatReconciliation varianceGap between (resident charges + owner share) and the invoice, ÷ invoiceMonthlyPrelim bill; master meter invoiceAny unexplained gapCorrection rateBills adjusted after approval ÷ bills issuedMonthlyActivity logRepeats in the same propertyDispute rateDisputes ÷ bills issued, per 100MonthlyProperty ticket logClusters in one buildingCycle timeDays from invoice receipt to charges postedMonthlyCycle datesDrifts toward a deadlineMeter healthMeters reporting valid reads ÷ meters installedMonthlyMeter platformSilent metersCompliance coverageLeases with required language ÷ active leasesQuarterlyLease filesGaps after renewals
How to run the scorecard
Run it monthly at the property level and quarterly at the portfolio level. The property manager owns cycle time, disputes and meter follow-up. The regional or asset manager owns the recovery trend. Finance reads the roll-up, which Billee's guide to what a CFO needs from utility reporting covers in detail.
Use one rule for every ratio: numerator and denominator come from the same billing period. Then set a flag line from your own history, such as one point below your trailing six-month average, and review every flag in writing.
The figures in the next three sections are illustrative and describe one 600-unit community with one submeter per unit.
Money KPIs: recovery, collections and vacant units
1. Effective recovery rate
Formula. Utility charges billed to residents ÷ utility costs paid to vendors, same period. If the property pays $40,000 and bills $34,000, recovery is 85%.
Where the data lives. The billing platform and the vendor invoices.
Warning sign. A falling trend. Some of the $6,000 gap is intentional, because common-area electricity and similar costs are owner expenses. Billee's guide to what 80–95% effective recovery means breaks down the four usual causes of a low reading.
2. Collection rate
Formula. Utility charges collected ÷ utility charges billed, same period. If residents pay $32,300 of $34,000 billed, collection is 95%.
Where the data lives. The property management system's resident ledger, where payments post.
Warning sign. Collection falls while recovery holds. Billing is right and payment is late, which is a different fix from a formula problem.
3. Vacant-unit cost share
Formula. Utility cost used by vacant units ÷ total utility cost, same period. If vacant units used $1,600 of $40,000, the share is 4%.
Where the data lives. Submeter reads or master-meter data matched against occupancy data.
Warning sign. The share rises while vacancy stays flat, which points to a unit running HVAC or leaking water. Rules add weight here: D.C. Law 26-156 bars separate billing for vacant-unit utilities from Jan. 1, 2027, except through monthly rent.
Accuracy KPIs: reconciliation and corrections
4. Reconciliation variance
Formula. The gap between (resident charges + owner-paid share) and the master-meter invoice, divided by the invoice. With $34,000 billed, $5,800 owner-paid and a $40,000 invoice, the $200 gap is a 0.5% variance.
Where the data lives. The preliminary bill and the invoice.
Warning sign. Any gap nobody can name. A variance you can explain is a policy choice. One you cannot is leakage.
5. Correction rate
Formula. Bills adjusted after approval or after issue ÷ bills issued. If 18 of 600 bills change, the rate is 3%.
Where the data lives. The activity log, which records each billing action, who took it and when.
Warning sign. Corrections repeat in one property or for one cause, such as a stale move-in date. Repeats mean a data feed is wrong, not that residents are unlucky.
Service and compliance KPIs: disputes, cycle time, meters and leases
6. Dispute rate and time to resolve
Formula. Disputes logged ÷ bills issued × 100, plus the median days to resolve. Twelve disputes on 600 bills is two per 100.
Where the data lives. The property's ticket or email log. Billee's guide to handling resident utility bill disputes shows what to record.
Warning sign. Disputes cluster in one building, which usually means a meter or an allocation issue and not a resident problem.
7. Cycle time
Formula. Days from receiving the last master-meter invoice to charges posting to the resident ledger. Invoices received on the 4th and charges posted on the 15th is 11 days.
Where the data lives. Cycle dates in the billing platform and the invoice record.
Warning sign. The number drifts toward a deadline. Virginia's State Corporation Commission rules for electric and gas submetering, for example, require bills no later than 15 days after the owner receives the utility's bill.
8. Meter health
Formula. Meters reporting valid reads ÷ meters installed, plus the median days from alert to resolution. If 588 of 600 meters report, the rate is 98%.
Where the data lives. The meter platform and the maintenance log.
Warning sign. Silent meters. A meter that stops transmitting does not raise an error; the billing system just receives nothing. Billee's guide to meter monitoring and proactive alerts explains how spike, drop and flatline alerts catch it.
9. Compliance coverage
Formula. Active leases carrying the required addendum or disclosure language ÷ active leases on billed properties. If 540 of 600 leases comply, coverage is 90%.
Where the data lives. Lease files and the addendum version log.
Warning sign. Gaps after renewals. In Maryland, a lease clause requiring payment of ratio-billed utilities is unenforceable if the landlord does not give eight written items to prospective residents, including the last two utility bills and the allocation method.
Reading the nine together
Pairs of KPIs diagnose faster than any single one. Recovery down with variance flat points to a vacant-unit or formula issue, because the cost is accounted for but not billed. Recovery down with meter health down points to hardware. Collection down with recovery flat points to payment follow-up. Disputes up with corrections up points to bad inputs.
How to set thresholds
Billee's portal treats an 80–95% effective recovery rate as strong performance and a reading below 80% as a signal to investigate. That is Billee's own framework, not an industry standard, and operators should still set flag lines from their own history. Do not compare a RUBS property with a submetered one without segmenting first.
How Billee Technologies helps
Billee Technologies pairs a platform with a named, dedicated account team. Your people review and approve. Billee's team does the work. For a scorecard, that means the recovery percentage, the cycle history and the billing activity log sit in one portal, and a named person is accountable for the exceptions behind them.
Read the numbers in the portal
The Billee dashboard shows total utilities billed and the overall recovery percentage, with a billing cycle progress tracker and a date picker that switches the page to any past cycle for historical review. Billing administrators can download a Detail Resident Report, with a per-resident breakdown, or an Itemized Report, with line-item charges across the property, from the Monthly Billing Cycle page.
Each month's preliminary bill arrives with Biller Highlights, the Billee team's notes on exceptions and items that need attention. Read the highlights before the detail.
Catch problems before the cycle closes
Administrators leave comments tied to each preliminary bill, and Billee replies within 1–2 business days. If the preliminary bill needs fresher data from the property management system, "Request New Report" regenerates it in 1–2 business days. After approval, Billee locks the report, and charges post to the resident ledger on the set date.
The activity log records every billing action, who performed it and when, which makes cycle time and correction history auditable. The dashboard's Move-Out Overview adds status counts for Past Due, Upcoming, Needs Review and Issue, and Billee's training materials say to check it daily.
Watch meters and vacant units
Billee's Meter Monitoring watches meter activity continuously and raises an alert when a reading spikes, drops or flatlines. The Billee team then dispatches a repair, contacts the resident, pulls the meter or escalates to the owner. Monitoring works on portfolios that already have submetering infrastructure.
Billee's Vacant Cost Recovery compares occupancy data from the property management system with actual meter usage. When a unit flagged as vacant shows usage above a configurable threshold, an exception is generated within the same week and routed to a named account team member who acts on it.
Check the method and the leases
Billee's Regulatory & Compliance service covers billing methodology audits, access to legal support and ongoing monitoring for rule changes. Access to legal support is not legal advice. Billee's guide to its regulatory and compliance support explains the scope.
A Billee audit reviews four required document categories for the same billing period: the current billing provider's reports, master meter invoices, lease agreements, and the property's W-9 and legal entity name. Billee's guide to preparing a billing methodology audit lists what reviewers ask for.
What to ask Billee for in writing
- Which of the nine KPIs appear natively in the portal, which need an export and which sit in the property management system.
- How corrections made after approval are logged and whether the log can be exported.
- Whether resident dispute counts and resolution times can be tracked alongside comments.
- Whether the meter reporting rate and alert-to-resolution time are available as reports.
- How cycle-time dates are recorded, from invoice receipt to ledger posting.
Who Billee is not for
- Portfolios under about 300 units, where Billee's full-service model is usually more than the job needs.
- Anyone looking for a legal opinion on how a state rule applies to a lease or a formula. Billee gives access to legal support, not legal advice, so involve counsel.
- Operators who want to run billing themselves with software alone. Billee's portal exists for review and approval, not self-service operation.
FAQ
What KPIs should multifamily operators track for utility billing?
Nine cover the cycle: effective recovery rate, collection rate, vacant-unit cost share, reconciliation variance, correction rate, dispute rate, cycle time, meter health and compliance coverage. Start with the first four, which show the dollar gap and whether the numbers can be trusted.
How do you calculate the utility recovery rate for an apartment community?
Divide utility charges billed to residents by utility costs paid to vendors for the same period. A property that pays $40,000 and bills $34,000 recovers 85%. Some of the gap can be intentional, such as owner-paid common-area electricity.
What is a good utility recovery rate?
Billee treats 80–95% as strong and a reading below 80% as a signal to investigate. That range is Billee's own framework, not an industry standard. Set your own flag line from six to twelve months of history, and segment RUBS and submetered properties.
Should operators track billed or collected utility recovery?
Both. Billed recovery shows whether the formula and data are right. Collected recovery, or the collection rate, shows whether residents pay. A drop in one with the other steady points to different fixes.
How often should operators review utility billing KPIs?
Review them monthly at the property level and quarterly at the portfolio level. Each monthly review should use the same billing period for every ratio and should record a written reason for every flag.
Which utility billing KPI should I start with?
Start with effective recovery rate and reconciliation variance. The first shows how much cost the property absorbs. The second shows whether the numbers add up, so you know whether to trust the first.
Who should own utility billing KPIs?
The property manager owns cycle time, disputes and meter follow-up. The regional or asset manager owns the recovery trend. Finance reads the portfolio roll-up and the exception history.
Billee handles utility billing, vacant cost recovery and vendor management for multifamily operators who want a dedicated team behind the software. If you want help building a scorecard for your portfolio, talk to the team about your portfolio.
Sources
- Council of the District of Columbia, "D.C. Law 26-156. Fair Housing Practices Amendment Act of 2026," accessed October 2026.
- Virginia Administrative Code, "State Corporation Commission, 20VAC5-305-90 (billing under the electricity and natural gas submetering rules)," accessed October 2026.
- Maryland General Assembly, "Real Property Article, Section 8-212.4," accessed October 2026.
Insights and Industry Trends