What a CFO Needs from Utility Reporting in Multifamily
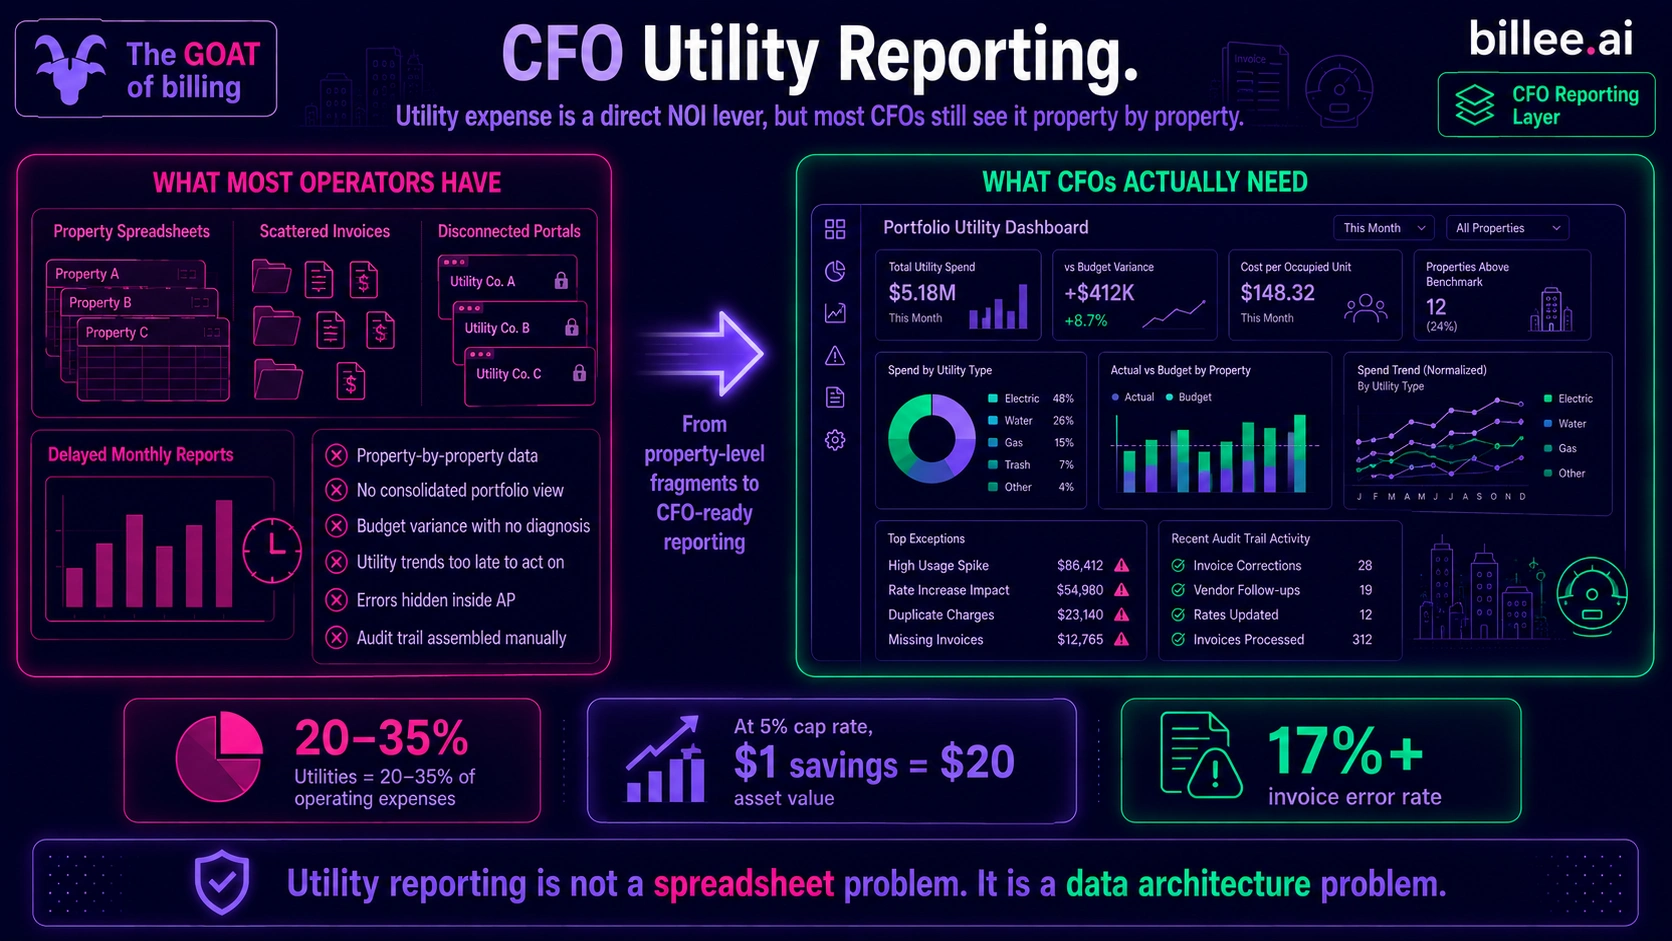
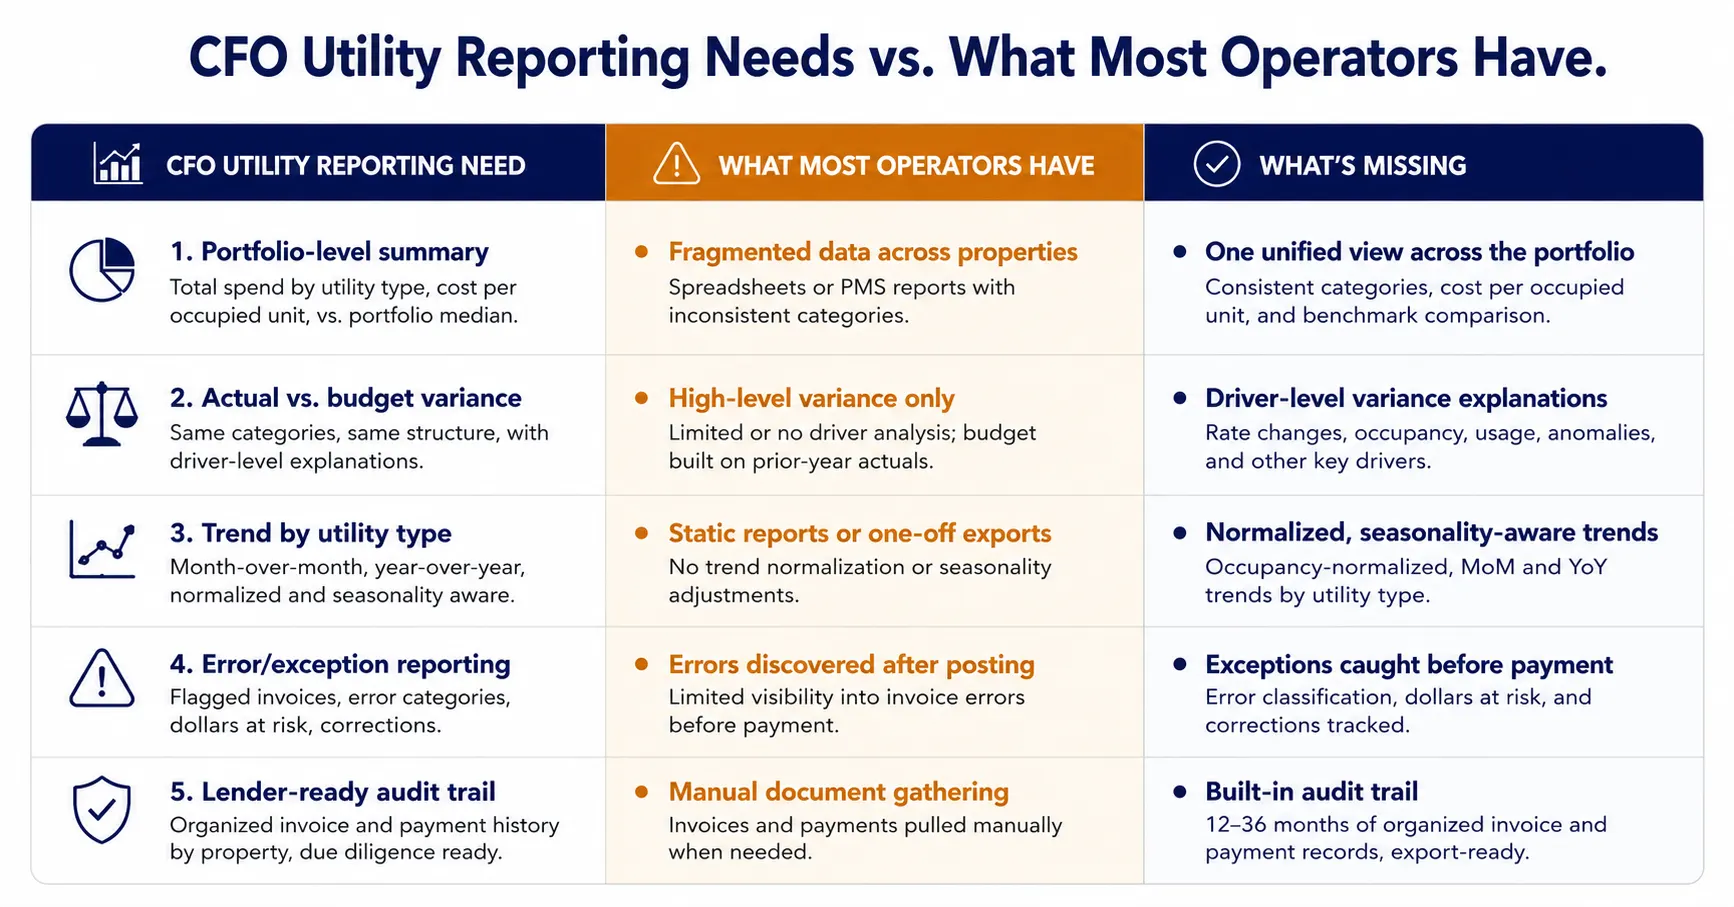
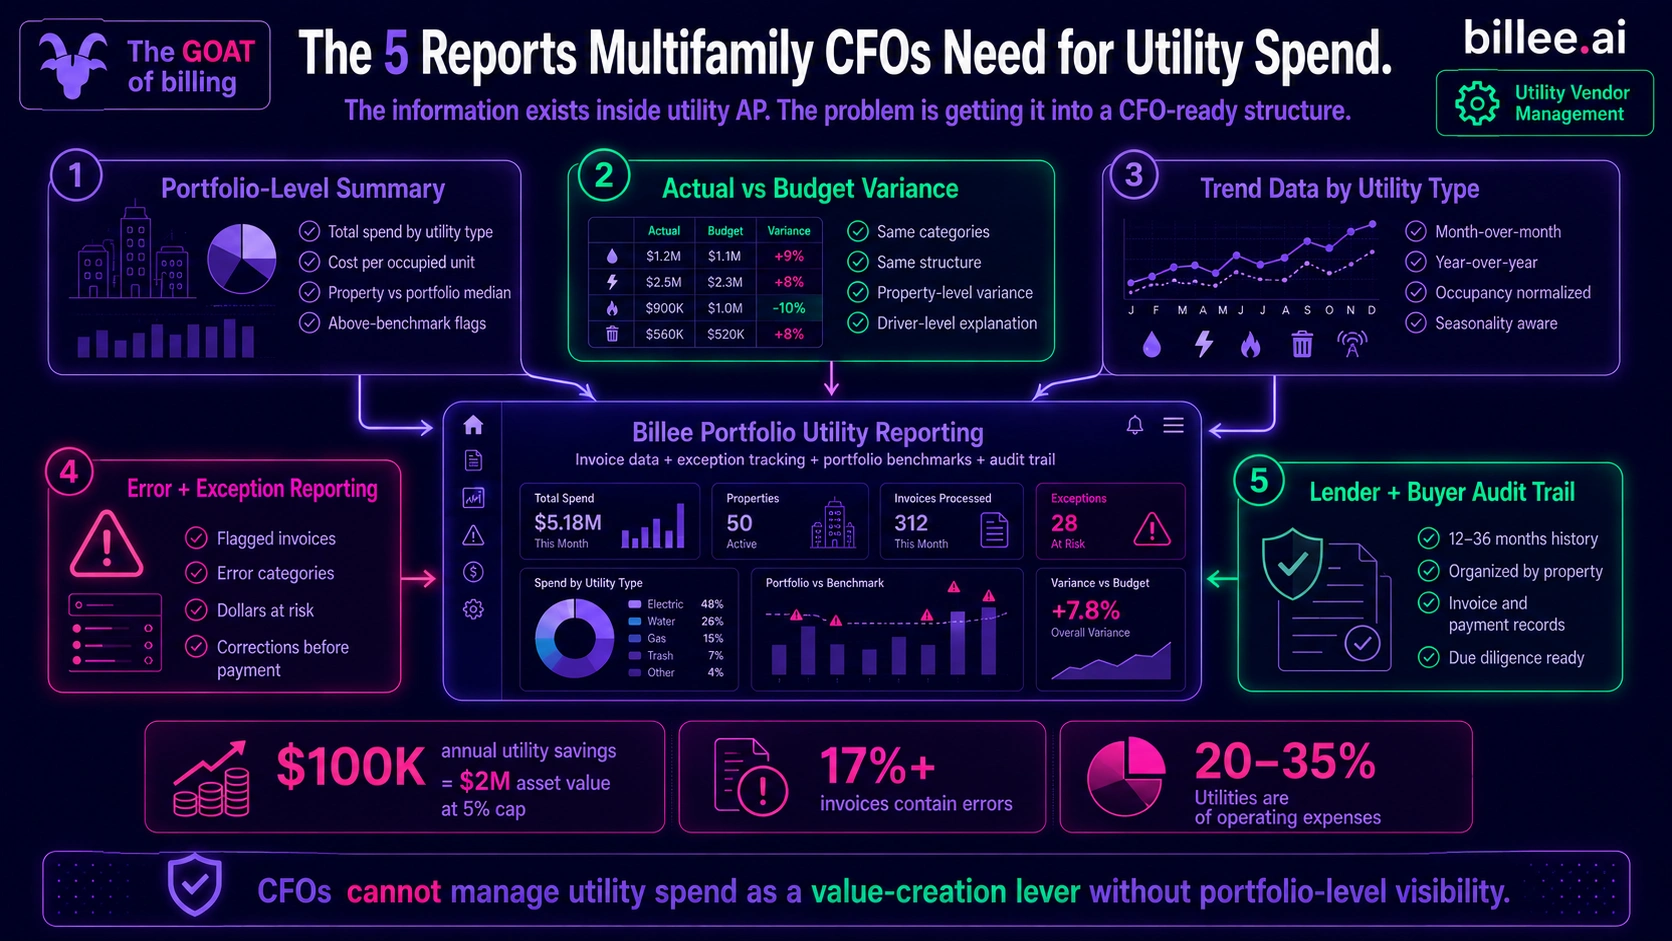
Utility expense is typically 20–35% of total multifamily operating expenses and one of the most direct levers on NOI, yet most CFOs receive utility data property by property, from multiple sources, with no consolidated view of portfolio-level spend, variance against budget, or trend over time. Effective utility reporting for a multifamily CFO requires five things: a portfolio-level summary, actual-vs.-budget variance by category and property, trend data by utility type, error and exception reporting, and a clean audit trail for lender and buyer diligence.
The gap between what most operators have and what CFOs actually need is not a reporting problem; it is a data architecture problem rooted in utility data being managed at the property level rather than the portfolio level. Billee's Utility Vendor Management product centralizes utility invoice data across the portfolio and delivers the reporting layer that multifamily CFOs need without requiring the finance team to assemble it from property-level spreadsheets.
Key Takeaways
Utility expense is a direct NOI lever. At a 5% cap rate, every $1 of annual utility savings across the portfolio adds $20 of asset value. A CFO who cannot see utility expense clearly cannot manage it as a value-creation tool.
Most CFOs receive utility data property by property, with no consolidated portfolio view, no variance breakdown by category, and no trend data current enough to act on.
Actual-vs.-budget variance analysis requires that the budget and the actuals use the same categories and structure. When budgets are built from estimates and actuals come from invoice-level data in different formats, the comparison collapses into a single over/under figure with no diagnostic value.
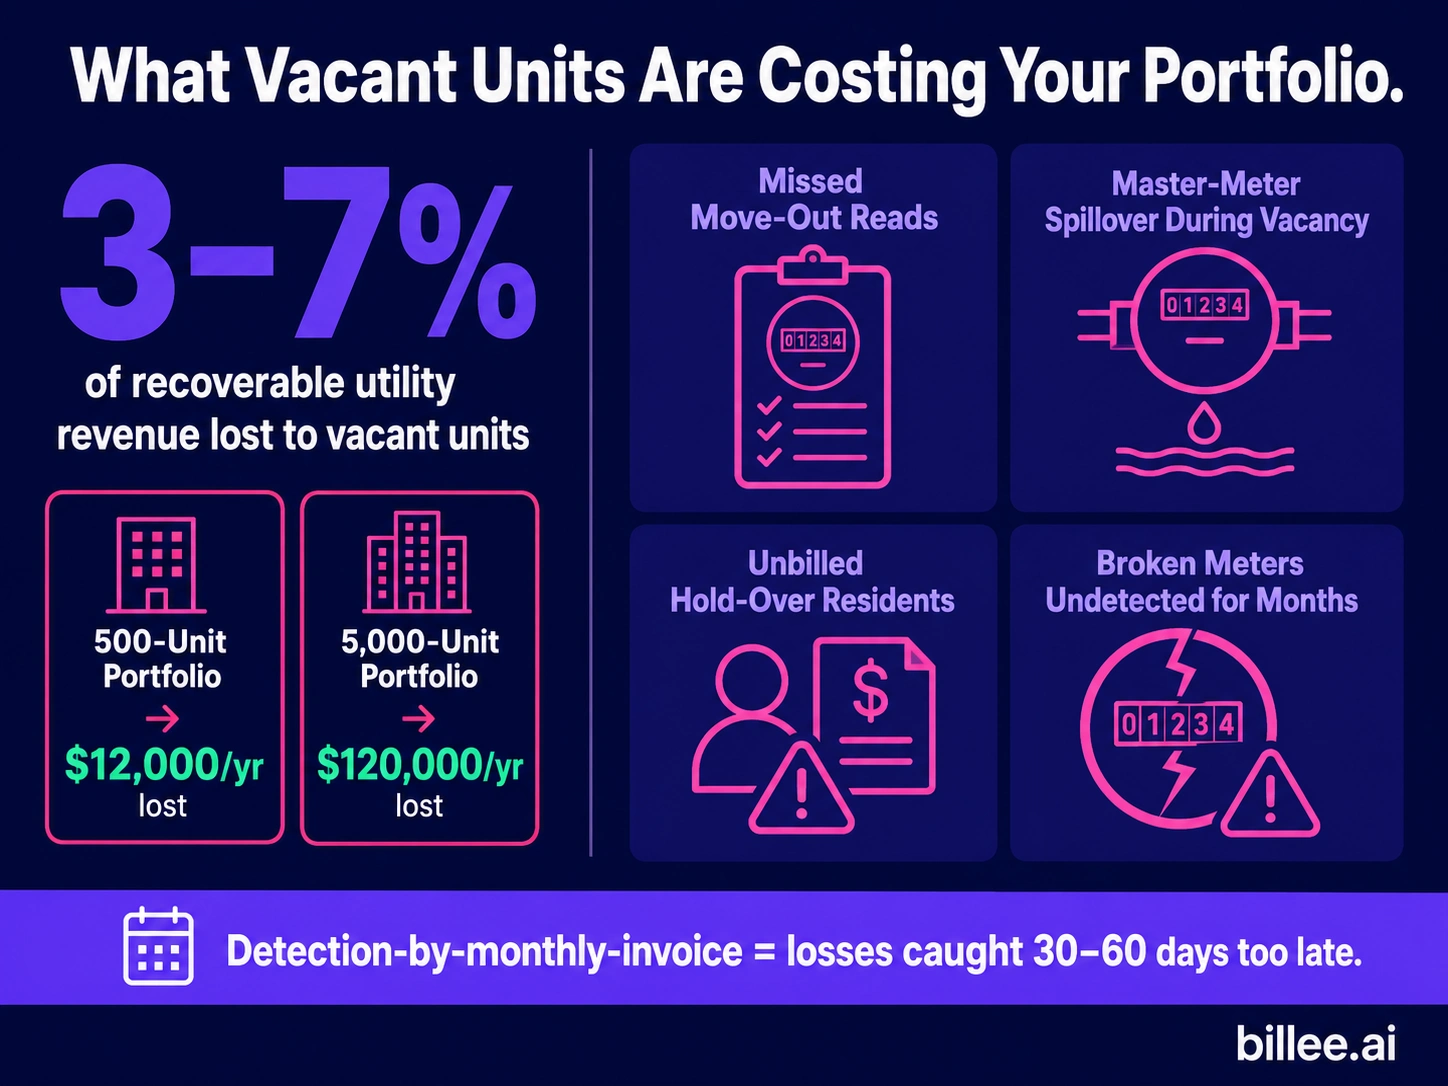
Error and exception reporting (how many billing errors were flagged, what dollar amount was corrected before payment) is a direct NOI line item that most CFOs never see as a separate report.
At refinancing or disposition, lenders and buyers request 12–36 months of utility invoice history organized by property. Operators whose utility data is scattered across portals and spreadsheets face a document-assembly task that can take weeks and produce an incomplete record.
Billee provides portfolio-level utility reporting, exception tracking, and a lender-ready audit trail as part of its Utility Vendor Management platform.
At a Glance: CFO Utility Reporting Needs vs. What Most Operators Have
Why Utility Reporting Is a CFO Issue, Not Just an Operations Issue
Utilities are not an operational detail to a CFO. They are a direct, recurring component of NOI, and the math is material: at a 5% cap rate, $100,000 in annual utility expense reduction across a portfolio translates to $2 million in asset value. That is not a property manager's lever; it is a CFO-level line item with direct implications for investor reporting, refinancing strategy, and disposition pricing.
The problem is that utility data typically lives in AP and operations, not in finance. The CFO receives a utility line in the monthly operating report, aggregated from property-level inputs that may be several weeks old, with no explanation of what drove the variance, whether the number is trending in the right direction, or how many errors were caught before they posted. The information that would make utility expense a manageable line exists inside the AP workflow; it just never makes it into the CFO's reporting package in a usable form.
Utility expense becomes a CFO-manageable line item only when the data structure behind it supports the reporting questions CFOs actually ask.
The Five Things CFO Utility Reporting Actually Requires
CFO-level utility reporting is not more property reports or a better spreadsheet template. It requires five structural components, each of which depends on having centralized, categorized invoice data as its foundation.
1. Portfolio-Level Summary
Most multifamily CFOs see utility expense the same way their operations teams do: property by property. Monthly operating reports may show utility expense as a line item per property, but the consolidated portfolio view, showing total water spend across all properties, cost per unit by utility type, and which properties are running above or below benchmark, typically does not exist without someone manually building it from property-level data.
The manual aggregation problem has two failure modes. It is slow: the consolidated report may arrive three to four weeks after the period closes, by which time the information has limited value for decision-making. And it introduces transcription and categorization risk at every step, meaning the consolidated figure the CFO sees may not match what actually hit the ledger at the property level.
Portfolio-level summary reporting should show total spend by utility type across the portfolio, cost per occupied unit per month for water, electric, and gas, and a comparison of each property against the portfolio median. Properties running 20% or more above the portfolio average on any utility type warrant investigation; the summary report is what surfaces them.
2. Actual vs. Budget Variance
Variance analysis is the core of CFO reporting for any cost line. For utility expense, it is structurally difficult because the budget and the actuals often use different categories. A budget built from a flat percentage increase on prior-year totals cannot be compared cleanly to actuals organized by vendor, property, and utility type. The categories do not align, and the comparison collapses into "utilities were over" or "utilities were under" with no information about what drove the variance or where to look.
The fix is not a better report template. It is building the budget from the same vendor-property-utility-type structure as the invoice data, so that budget and actual can be compared at the same level of granularity. When that data architecture is in place, variance analysis becomes a mechanical output: water at Property A ran $4,200 over budget in Q3 because of a rate increase that was not reflected in the budget line and a usage spike that has since been resolved. Without that structure, the CFO is looking at aggregates that obscure the cause.
For a practical reference on building utility budgets that align with invoice-level actuals, the budget forecasting article covers the four-input model in detail.
3. Trend Data by Utility Type
A point-in-time comparison of actual vs. budget tells the CFO whether the period was on track. Trend data tells them whether the portfolio is moving in the right direction. Those are different questions and they require different views.
Trend reporting for utility expense should show month-over-month and year-over-year movement by utility type, normalized for occupancy and seasonality where possible. An electric trend that is rising 8% year-over-year while the portfolio's occupancy has been flat is a signal worth investigating. A water trend that has declined 5% year-over-year following a conservation fixture program is a quantified return on that investment.
Without trend data, CFOs make decisions about utility programs, vendor relationships, and capital allocation based on a single period's performance. A property that looks fine this month may be running a consistent upward trend that only becomes visible across 12 months of data. Trend reports do not require new data; they require that the existing invoice data be organized and retained in a structure that supports the time-series view.
4. Error and Exception Reporting
Every billing error caught before payment and corrected is a direct NOI recovery. Every error that posts to the ledger and requires a credit memo, a revised invoice, and a correcting AP entry is a direct NOI loss, plus the labor cost of the correction cycle. At ENGIE Impact's documented 17% invoice error rate, a portfolio processing 300 invoices per month has roughly 51 flagged invoices per cycle. Even at an average recovery of $150 per corrected error, the monthly aggregate is a reportable number, and over 12 months it is a meaningful NOI line item.
CFOs should have a monthly exception report that shows: how many invoices were flagged during the audit step, what error categories were identified (amount discrepancy, rate error, duplicate charge, usage anomaly), what dollar amount was at risk, and what amount was corrected before payment. This turns the invoice audit process from an operational workflow into a CFO-visible metric with direct NOI attribution. Most operators do not have this report because their utility AP does not run a structured audit step; there is nothing to report. For portfolios that do run a structured audit, the exception report is one of the clearest ROI demonstrations available.
5. Lender and Buyer Audit Trail
At refinancing or disposition, lenders and buyers request utility expense history. The standard request is 12–36 months of utility invoices and payment records, organized by property and utility type, demonstrating consistent payment, no material service gaps, and no unresolved billing disputes. This documentation request arrives during due diligence, when the transaction timeline is already compressed and the cost of delays is high.
Operators whose utility data is scattered across vendor portals, property-level accounting files, and email inboxes face a document-assembly task that can take two to four weeks and often produces an incomplete record, with gaps for accounts that changed during the period, invoices that were processed outside the normal workflow, or properties acquired mid-hold where historical records were never centralized. Gaps in utility payment history are a risk factor in buyer underwriting; a complete, verifiable record eliminates that risk and supports the seller's stated NOI.
The audit trail value compounds with time. A portfolio that has been on a centralized utility management platform for three years arrives at disposition with a clean, organized record that accelerates due diligence, reduces buyer questions, and removes the documentation gaps that buyers use to justify price adjustments.
How Billee Provides CFO-Ready Utility Reporting
Billee's platform centralizes every processed invoice by property, vendor, and utility type, creating the consolidated record that CFO-level reporting requires. The customer portal at app.billee.ai provides a current-period summary of all utility statements across the portfolio and a historical view of every processed invoice, updated as invoices are received, audited, and posted.
The exception reporting function captures every invoice flagged during the audit step: the error type, the dollar amount at risk, and the resolution before payment. For CFOs who want to see utility management as an active NOI line rather than a passive cost, that exception report is the mechanism. For lender and buyer diligence packages, Billee's invoice history is the audit trail: organized by property and period, complete, and verifiable from a single source without a manual assembly project.
For operators who want to understand the AP workflow that produces the reporting data, the utility vendor management overview, the AP automation article, and the portfolio invoice management article cover those mechanics in detail.
Implementation takes 45 days. Vendor onboarding, rate schedule configuration, and PMS integration are handled by the Billee team.
Billee gives multifamily CFOs the utility reporting layer that operations alone cannot produce: portfolio-level summaries, exception tracking, and a lender-ready audit trail. See how it works for your portfolio.
Sources
National Apartment Association, "Income & Expense Survey," accessed June 2026. (Documents utilities as a percentage of total multifamily operating expenses by property type.)
Zego, "The Top 3 Utility Accounts Payable Mistakes Multifamily Companies Make," 2025. (Cites ENGIE Impact audit finding: at least 17% of utility invoices contain a billing error.)
Insights and Industry Trends