

Executive Reporting & Forecasting: Board-Ready Numbers Without the Quarterly Scramble
Utility expense runs 20–35% of total multifamily operating expenses, yet most portfolios manage that data as scattered vendor portals and spreadsheets. Billee centralizes invoice history, consumption trends, and rate data, so board-ready reports and lender due diligence become an export, not a project.
See what that looks like for your portfolio →Every invoice, centralized automatically
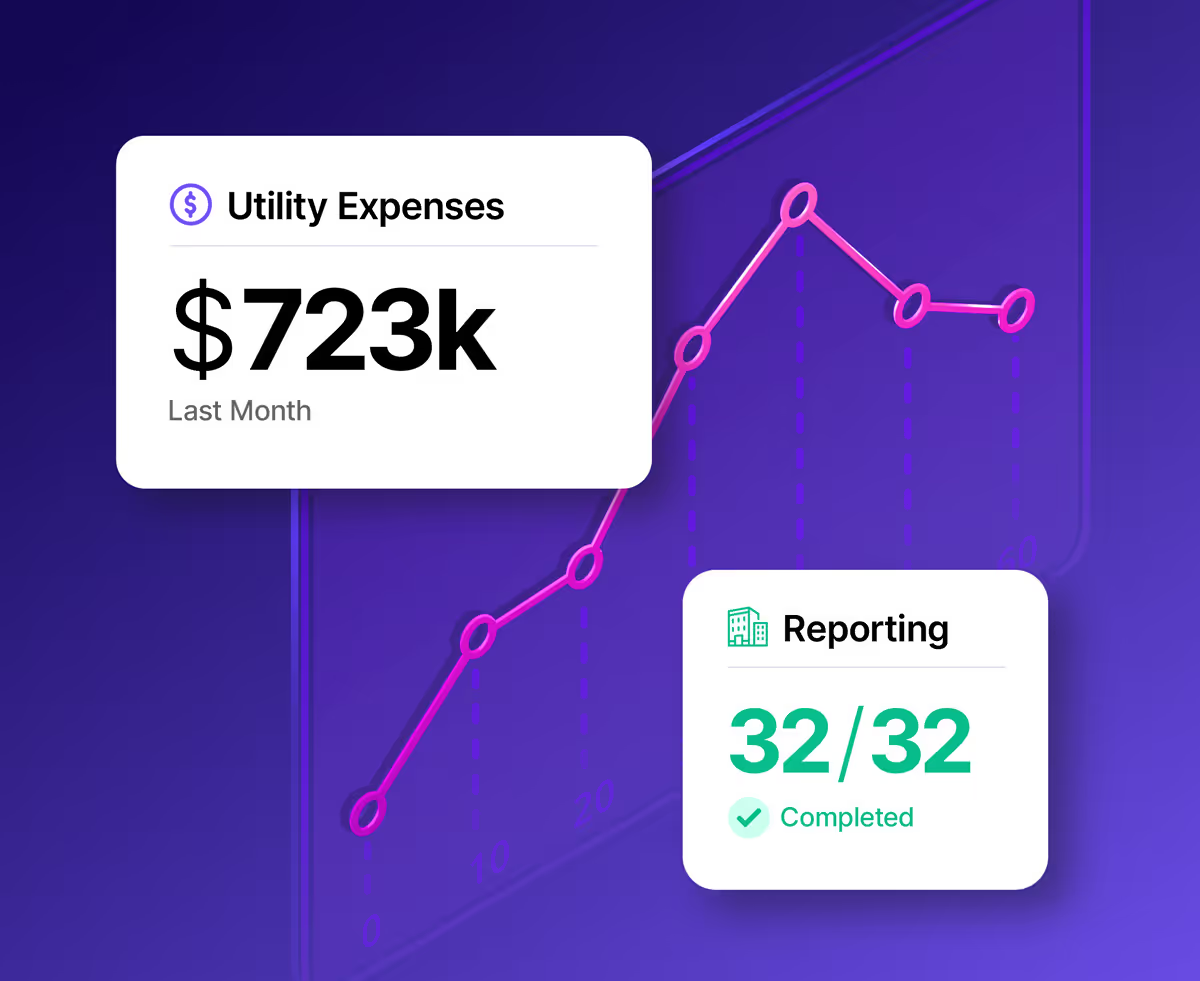
Billee's dashboard shows invoice history, consumption trends, and recovery performance for every property in the portfolio, organized and ready to export whenever the board or a lender needs it.
Your data lives in a dozen places
When the CFO needs a variance report or a lender wants two years of invoice history, someone spends days assembling something that should already exist. Utility invoices also carry a documented error rate as high as 17% industrywide, so a 300-invoice-a-month portfolio faces roughly 51 flagged invoices a cycle if nothing catches them early.
How Executive Reporting & Forecasting works
Billee centralizes every utility invoice by property, vendor, and utility type, as billing runs each cycle.
The portal's Recovery Performance Breakdown and Activity Log give you a running, auditable record without a manual pull.
Exception reporting flags invoice errors and irregular charges before they post to the general ledger.
Historical invoice, consumption, and rate data stays organized by property and date, ready to assemble into 12–36 months of history in minutes.
That same historical base, actuals, rate schedules, occupancy, and consumption trends, is what your team uses to build next year's budget.
When something in the data looks off, a named Billee account manager explains it. Reporting questions don't sit in a support queue.
Everything Executive Reporting & Forecasting covers
Centralized invoices.
Organized by property, vendor, and utility type.
Recovery Performance Breakdown.
Total utilities billed and recovery percentage against Billee's 80–95% benchmark.
Full Activity Log.
Every billing action documented, ready for audits and quarterly business reviews.
Exception reporting.
Flagged invoices, error types, and dollar amounts.
Two report formats.
A per-resident Detail Resident Report and a property-level Itemized Report.
Organized history.
Invoice, consumption, and rate data ready for forecasting and lender due diligence.
Executive Reporting & Forecasting at a glance
At a 5% cap rate, every dollar of annual utility savings adds roughly $20 of asset value, so a $100,000 reduction can add on the order of $2 million in asset value under standard cap rate math. Clean, exportable reporting is what makes a number like that defensible.
Works With the Systems You Already Run
Billee syncs invoice, billing, and occupancy data from Yardi Voyager, Yardi Breeze, RealPage, and Entrata, so executive reports match your system of record.




Built for portfolios like yours
Owners and asset managers who need portfolio-level performance without asking property by property
CFOs building or defending a utility budget against actual spend
Teams preparing a refinancing or disposition package
Regional managers running quarterly business reviews across a multi-property portfolio
Executive Reporting & Forecasting, Answered
Straight answers about how Executive Reporting & Forecasting works, from the same account team that runs it for your portfolio.
What does Billee's Executive Reporting & Forecasting cover?
Executive Reporting & Forecasting centralizes invoice history, consumption data, recovery performance, and rate schedules across your portfolio into board-ready reports, so finance and asset management teams aren't assembling data by hand every quarter.
How much of my operating budget is utility expense?
Utility expense typically represents 20 to 35% of total multifamily operating expenses, per the National Apartment Association's Income & Expenses Survey. That makes it one of the largest line items finance teams track after payroll and insurance.
Can Billee help with lender or buyer due diligence?
Yes. Billee keeps organized invoice and billing history by property, and lenders and buyers typically request 12 to 36 months of that history during refinancing or disposition. Billee's portal makes that record exportable rather than something your team has to reconstruct.
Does Billee build the utility budget forecast for me?
Billee centralizes the four inputs a reliable forecast needs, historical actuals, current rate schedules, occupancy projections, and consumption trends, so your finance team builds the forecast on clean data instead of raw invoice totals.
How does Billee catch billing errors before they affect reporting?
Billee's exception reporting flags irregular invoices and charges as they're processed, before they post to the general ledger or a resident's account. Invoice error rates run as high as 17% industrywide, so catching them early keeps downstream reporting accurate.
What's the difference between this and my property management system's reporting?
Most PMS reporting reflects what's already posted. Billee's Executive Reporting layer adds exception data, recovery performance against Billee's benchmark, and organized historical trend data that a standard PMS report doesn't consolidate on its own.
How fast can I get a report ready for my board or investors?
Recovery performance, activity logs, and itemized reports are available from your first billing cycle, and historical data stays organized by property and date, so a board-ready export doesn't require a special data-gathering project.
Ready to see it on your portfolio?
Billee already manages your utility data, so board-ready reporting and forecasting are a byproduct of billing, not another quarterly project.
See what that looks like for your portfolio →Sources: National Apartment Association, Income & Expenses Survey, accessed 2026; ENGIE Impact, Utility Bill Audit Services, accessed 2026.
Get in touch
Utilities should be the easiest part of your operation