

Vacant Unit Utility Loss Benchmarks by Portfolio Size
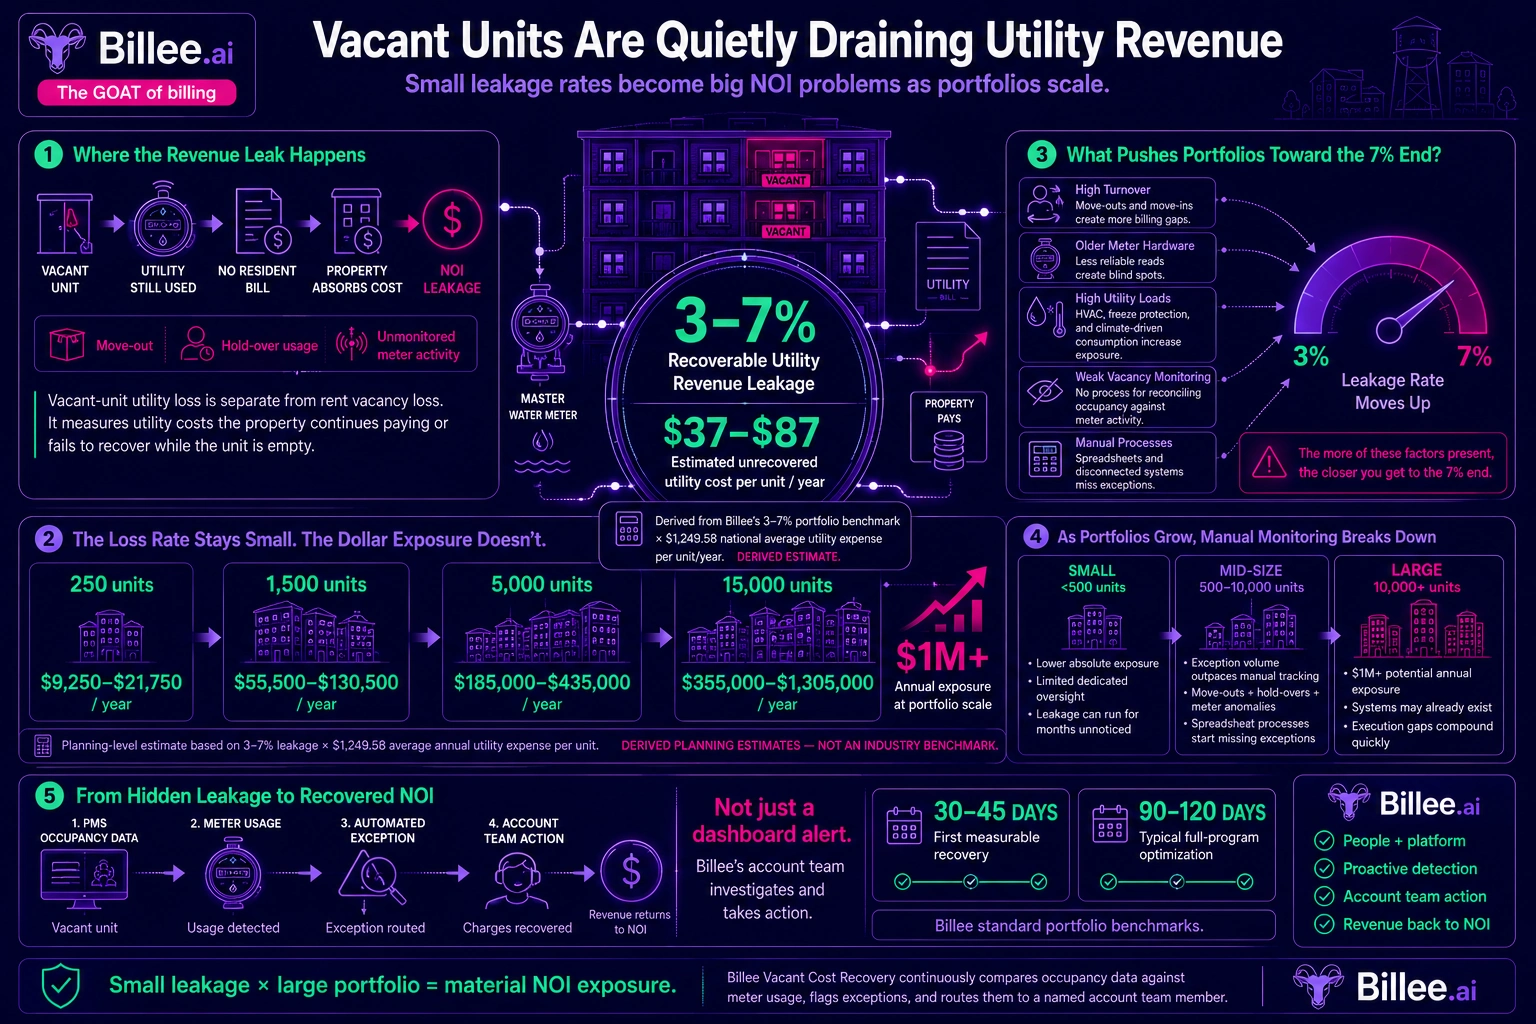
Vacant units drain 3 to 7 percent of a typical multifamily portfolio's recoverable utility revenue, per Billee's standard portfolio benchmark. Applied to the national average utility expense of $1,249.58 per unit per year, that works out to roughly $37 to $87 in unrecovered utility cost per unit, per year, portfolio-wide. The loss rate holds steady as a portfolio grows, but the dollar exposure does not. It scales from roughly $9,250 to $21,750 a year on a 250-unit property to well over $1 million a year on a 15,000-unit portfolio.
Key takeaways
- Vacant units leak 3 to 7 percent of a portfolio's recoverable utility revenue, per Billee's standard benchmark, drawn from its own customer data.
- The national average utility expense is $1,249.58 per unit per year, per the IREM/NAA Income/Expense IQ National Summary (2024 data).
- Combined, those two figures put typical vacant-unit utility loss at roughly $37 to $87 per unit per year, portfolio-wide: a derived estimate, not a published, size-segmented statistic.
- No industry source currently breaks vacant-unit utility loss out by portfolio size, so this article shows the math transparently instead of presenting an invented benchmark table.
- The loss rate stays roughly constant across portfolio sizes. The dollar exposure does not. It runs from roughly $9,250 a year on a 250-unit property to well over $1 million a year on a 15,000-unit portfolio.
- Smaller portfolios carry lower absolute dollar exposure but often have no one specifically watching for this leakage, so it can run longer before anyone catches it.
How much vacant units actually cost in utility loss
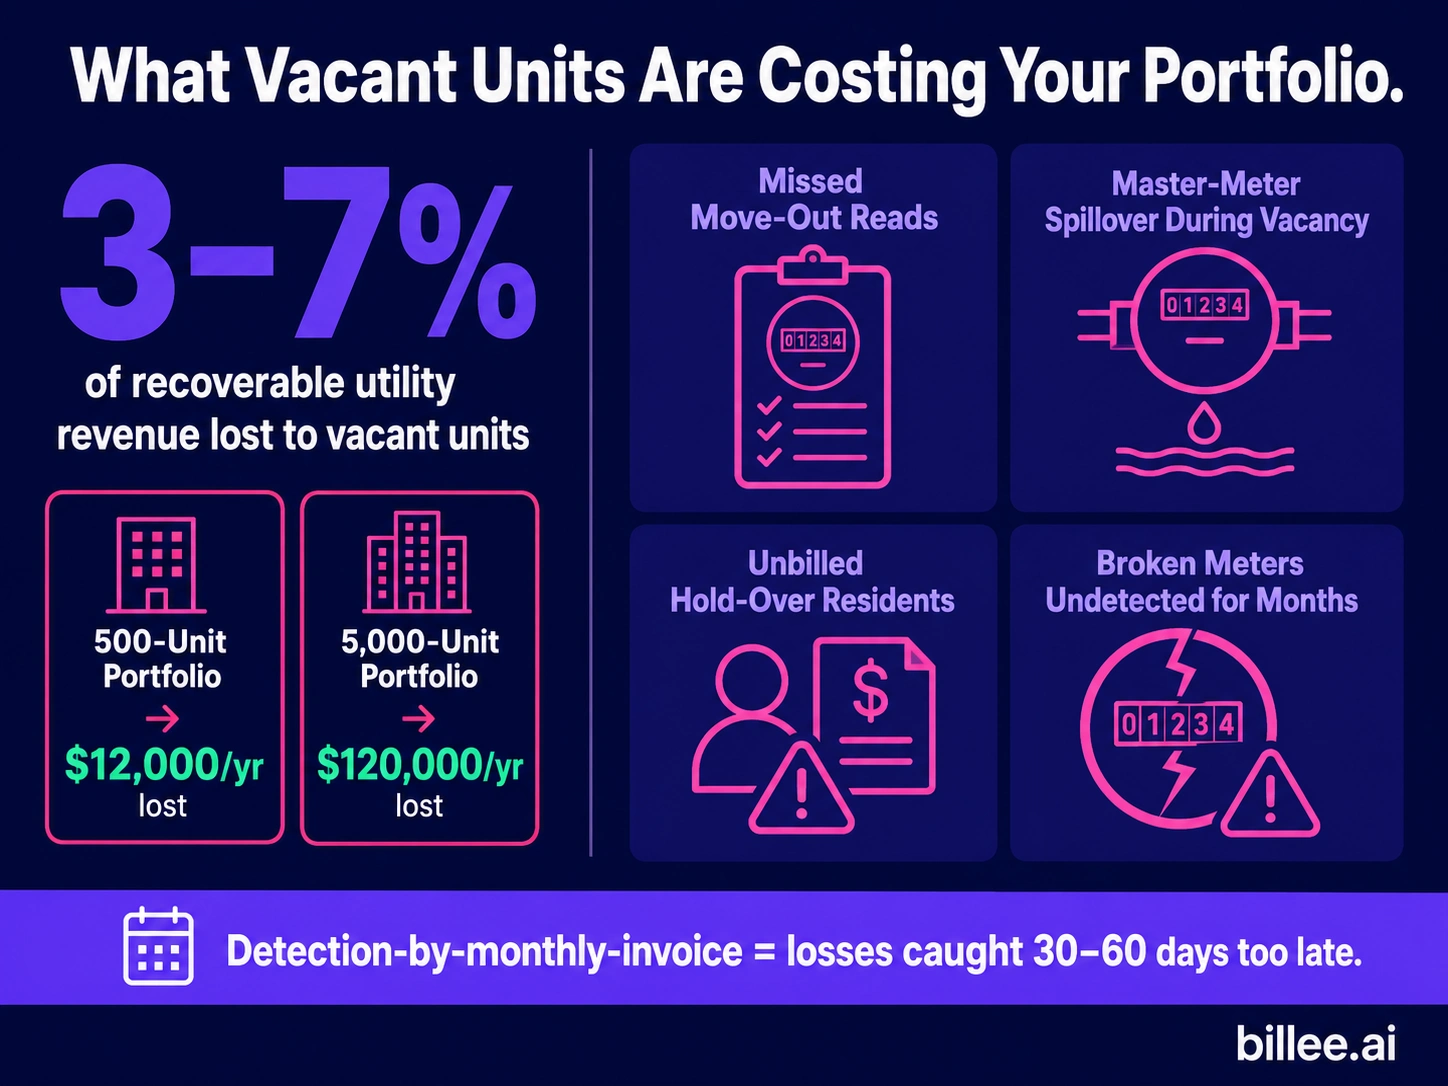
Vacant units typically leak 3 to 7 percent of a multifamily portfolio's recoverable utility revenue, per Billee's own portfolio benchmark. No independent industry study currently publishes a fixed percentage for vacant-unit leakage specifically, since most vacancy research tracks rent loss, not utility loss.
The national average utility expense across a multifamily unit is $1,249.58 per year, per the IREM/NAA Income/Expense IQ National Summary. Applying Billee's 3 to 7 percent leakage rate to that figure produces a derived range of $37 to $87 in unrecovered utility cost per unit, per year, portfolio-wide.
The $37 to $87 range is arithmetic on two real, cited inputs, not a published benchmark that already segments loss by portfolio size. No such source currently exists. Multiplying a real leakage rate by a real national utility-cost figure is the most accurate way to estimate the exposure without inventing a number, and that gap quietly drains net operating income every month it goes uncaught.
Vacant-unit utility loss is a different number from vacancy and rent loss. The same IREM/NAA summary separately reports $1,080.87 per unit per year in vacancy and rent loss for 2024, the forgone rental income while a unit sits empty. Vacant-unit utility loss measures the utility cost a property keeps paying, or fails to recover, during that same empty period. The two figures measure different things and are not additive without adjustment.
Where a specific portfolio lands within the 3 to 7 percent range depends on a few factors. Climate-driven markets with heavy HVAC and freeze-protection loads (Phoenix, Houston, and Miami in summer), portfolios with higher turnover (student housing, build-to-rent, class C properties), and portfolios running older meter-reading hardware all tend to sit toward the higher end. Tighter-vacancy, newer-infrastructure portfolios tend to sit toward the lower end.
Why the dollar impact scales with portfolio size
The loss rate does not change with portfolio size. Multiplying a fixed percentage by more units means the dollar exposure grows directly with the portfolio, a dynamic Billee has traced through the NOI math in How Vacant Cost Recovery Protects NOI. A portfolio ten times the size carries roughly ten times the dollar exposure at the same leakage rate.
At the national average utility cost, a 250-unit property carries roughly $9,250 to $21,750 a year in vacant-unit utility exposure. A 15,000-unit portfolio carries roughly $555,000 to $1,305,000 a year at the same leakage rate. The full range across the industry's typical portfolio-size bands appears in the table below.
What changes operationally at each portfolio size
Small portfolios, generally under 500 units, carry the smallest absolute dollar exposure on this list. They also tend to have the least dedicated oversight: a regional manager watching five or six properties rarely has a standing process for reconciling vacant-unit meter activity against occupancy data every cycle. Leakage in this range often runs for months before anyone traces it back to a specific unit.
Billee's own service model is generally built for portfolios of roughly 500 units and up, since a dedicated account team makes the most operational sense at that scale. Very small portfolios, under roughly 300 units, often handle this kind of monitoring in-house instead.
Mid-size portfolios, roughly 500 to 10,000 units, are where exception volume typically outpaces what a regional manager can track by hand. A portfolio in the low thousands of units generates enough move-outs, hold-overs, and meter anomalies each month that a spreadsheet-based process starts missing things, not because the methodology is wrong, but because the process cannot keep up. Common Mistakes When Charging Vacant Unit Utility Fees covers the specific operational gaps that show up most often at this scale.
Large portfolios, above 10,000 units, carry the highest absolute dollar exposure on this list, often well over $1 million a year at the high end of the leakage range. They also tend to have more infrastructure already in place: PMS-integrated meter data, dedicated operations staff, and established reporting. The gap is more often a process-execution problem than a total blind spot, but the stakes are high enough that even a small process gap compounds into a material number fast. Operators who want the fix, not just the benchmark, can follow How to Recover Utility Costs from Vacant Units.
Vacant unit utility loss by portfolio size, at a glance
The table below applies Billee's 3 to 7 percent leakage benchmark to the national average utility expense of $1,249.58 per unit per year, across four common portfolio-size bands.
| Portfolio size | Representative unit count | Low-end annual exposure (3%) | High-end annual exposure (7%) |
|---|---|---|---|
| Under 500 units | 250 units | $9,250 | $21,750 |
| 500–2,500 units | 1,500 units | $55,500 | $130,500 |
| 2,500–10,000 units | 5,000 units | $185,000 | $435,000 |
| 10,000+ units | 15,000 units | $555,000 | $1,305,000 |
The table above is a planning-level estimate built from two real, cited inputs, not a published, portfolio-size-segmented statistic. Actual exposure depends on climate, local utility rates, and each portfolio's specific vacancy pattern.
How to estimate your own portfolio's exposure
Three inputs turn this national benchmark into a portfolio-specific number.
First, find the actual average utility cost per unit per year for the portfolio, using master-meter invoices and existing billing data rather than the national average. Local utility rates, climate, and unit mix can push this figure well above or below $1,249.58.
Second, apply a leakage-rate assumption. Billee's 3 to 7 percent range is a reasonable starting point. A portfolio with high turnover or older submetering hardware likely sits toward the higher end, and a portfolio with tight vacancy and newer meter-reading infrastructure likely sits toward the lower end. How to Benchmark Utility Consumption Across Multifamily Properties covers building a more property-specific baseline.
Third, multiply the result by total unit count to get the portfolio-wide dollar range. Treat the output as a planning-level estimate, not an audited number. An actual effective recovery rate calculation, or a full billing methodology audit, is what turns the estimate into a defensible figure.
How Billee fits in
Billee's Vacant Cost Recovery product is built to close this exact gap. The engine checks occupancy data from the property's PMS against actual meter usage continuously, so a unit marked vacant never quietly falls out of view.
When a vacant unit shows usage above a configurable threshold, an exception generates within the same week and routes to a named Billee account team member, not a dashboard alert nobody checks. The team investigates, corrects the billing, and recovers the charges, closing the loop instead of just flagging it.
Most portfolios see first measurable recovery within 30 to 45 days of turning VCR on, one full billing cycle. Full program optimization, meaning threshold calibration by unit type and climate zone, typically takes 90 to 120 days. Both are Billee's standard benchmarks, tracked on the customer dashboard.
Operators managing this loss in-house today can still use the benchmark table above as a planning tool, then bring in a managed program once exception volume outpaces what a regional team can track by hand. For portfolios approaching a refinancing or disposition event, a documented recovery rate from an active VCR program carries far more weight with buyers and lenders than a benchmark estimate.
FAQ
What percentage of utility costs do vacant units typically waste?
Vacant units typically waste 3 to 7 percent of a multifamily portfolio's recoverable utility revenue, per Billee's standard portfolio benchmark drawn from its own customer data. No independent industry study currently publishes a fixed percentage specific to vacant-unit leakage. The rate holds fairly steady regardless of portfolio size, but the dollar impact does not.
Does the vacant-unit loss percentage change with portfolio size?
The percentage itself does not change meaningfully with portfolio size. What changes is the dollar amount that percentage represents, since the same rate gets multiplied across more units.
How much utility cost does a 500-unit portfolio lose to vacant units in a year?
A 500-unit portfolio can expect to lose roughly $18,500 to $43,500 a year to vacant-unit utility leakage, based on the national average utility expense of $1,249.58 per unit per year and a 3 to 7 percent leakage rate. Actual exposure depends on climate, utility rates, and the property's specific vacancy pattern.
How much utility cost does a 5,000-unit portfolio lose to vacant units in a year?
A 5,000-unit portfolio can expect to lose roughly $185,000 to $435,000 a year under the same benchmark. At that scale, even the low end of the range is a meaningful NOI line item worth a dedicated recovery process.
Why do small portfolios often miss this even though the dollar amount is smaller?
Small portfolios often lack a staff member whose job specifically includes watching vacant-unit meter activity, so leakage can run for months before anyone notices it on the master meter bill. The dollar exposure is smaller in absolute terms, but it is proportionally just as real.
Is this the same thing as vacancy and rent loss?
Vacant-unit utility loss is not the same as vacancy and rent loss. Vacancy and rent loss measures the rental income a property forgoes while a unit sits empty, while vacant-unit utility loss measures the utility costs the property keeps paying, or fails to recover, during that same empty period. The two are related but separate line items.
How is this benchmark calculated?
The benchmark applies Billee's standard 3 to 7 percent vacant-unit leakage rate to the national average utility expense of $1,249.58 per unit per year, reported by the IREM/NAA Income/Expense IQ National Summary. No published source currently segments this figure by portfolio size, so the range shown here is derived math on two real, cited inputs rather than a found statistic.
Does Billee help recover this specific loss?
Billee helps recover this specific loss through its Vacant Cost Recovery product, which monitors occupancy data against meter usage continuously and routes every exception to a named account team member who takes action, not just a dashboard alert.
Billee runs Vacant Cost Recovery across the portfolio: the engine flags exceptions, the team takes action, and the recovered revenue lands back in NOI. See how it works for portfolios like yours.
Sources
- Institute of Real Estate Management, "Income/Expense IQ National Summary 2024 Operating Data," 2024.
Insights and Industry Trends



Explore more insights