

The ESG Data Pipeline: How Sustainability Leads Actually Pull Portfolio-Wide Consumption Data for Reporting
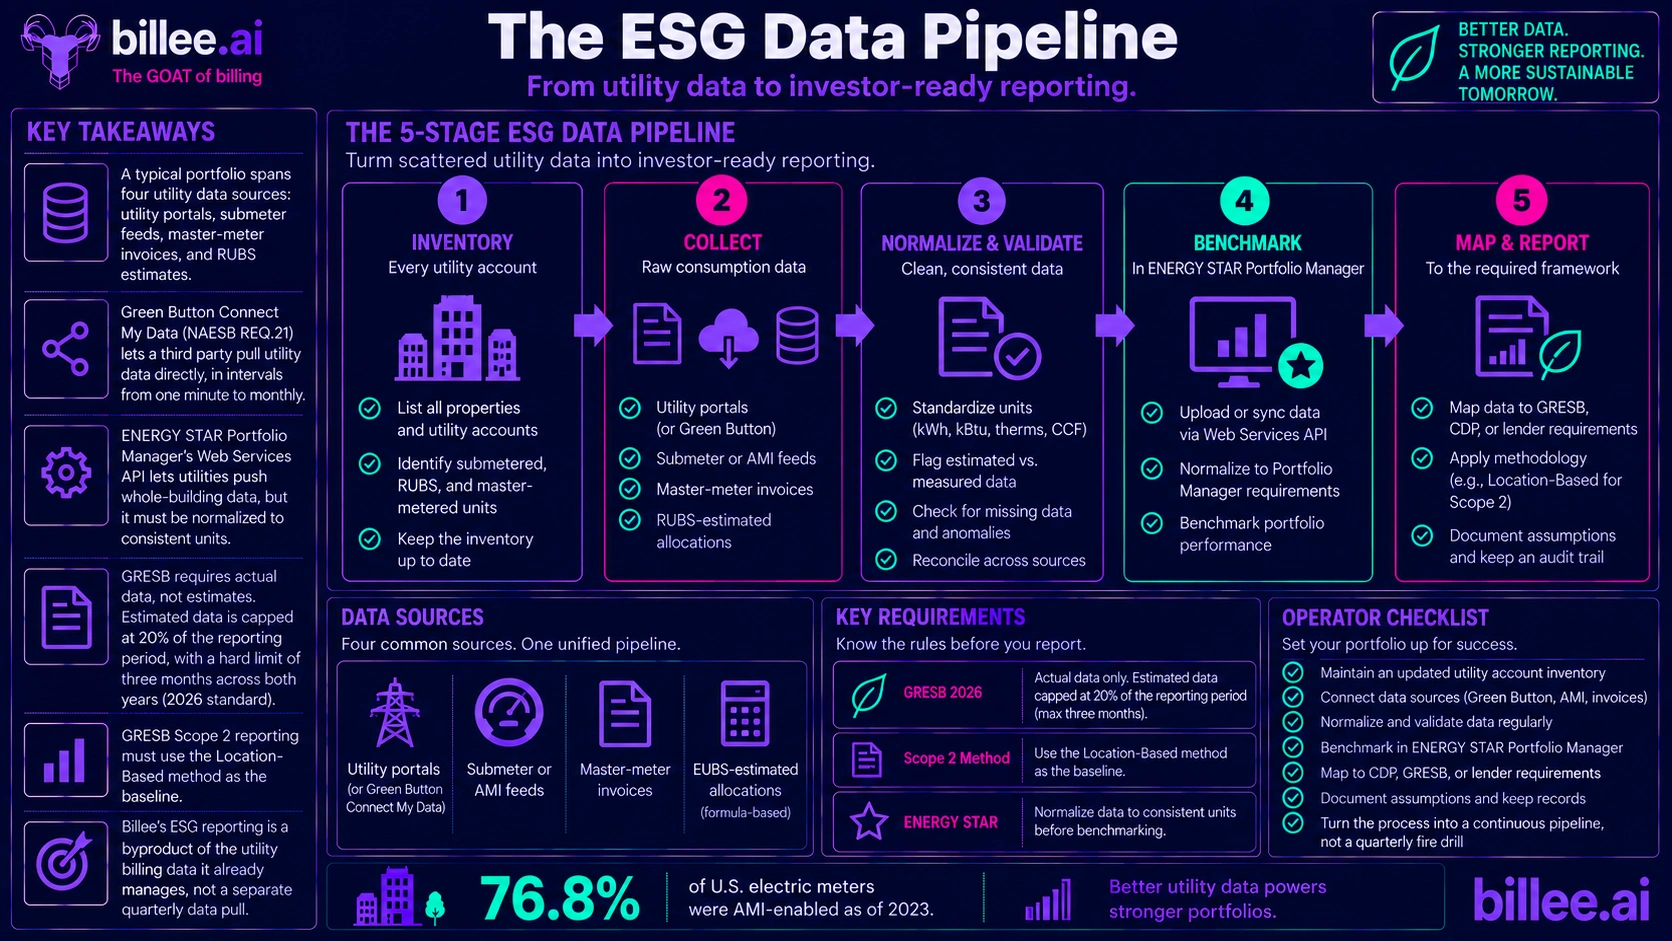
Pulling portfolio-wide consumption data for ESG reporting runs through five stages: inventorying every utility account, collecting the raw data from wherever it lives, normalizing and validating it, benchmarking it in ENERGY STAR Portfolio Manager, and mapping the output to the framework a lender or investor requires. Most sustainability leads still run this by hand every quarter, and Billee runs it as one continuous pipeline instead, since it already manages the underlying utility data.
Quick answer
The hard part of ESG reporting was never the reporting itself. It's collecting consumption data scattered across dozens of utility logins, submeter dashboards, and property spreadsheets, in three or four different units, with nothing forcing those sources to reconcile.
A sustainability lead covering a few hundred units can usually get through this manually. One covering thousands of units across multiple markets is running a data-engineering project out of a spreadsheet, every quarter.
Key takeaways
- A typical portfolio spans four utility data sources: utility portals, submeter or AMI feeds, master-meter invoices, and RUBS-estimated allocations, each with its own login, format, and schedule.
- Green Button Connect My Data, formally NAESB REQ.21, lets a third party pull utility data directly with authorization, in intervals from one minute to monthly, depending on the meter.
- ENERGY STAR Portfolio Manager's Web Services API lets utilities push whole-building data automatically, but it still has to be normalized to consistent units before Portfolio Manager can benchmark it.
- GRESB requires actual data, not estimates. Its 2026 standard caps estimated data at 20% of the reporting period, with a hard limit of three months across both years.
- GRESB's Scope 2 reporting must use the Location-Based method as the baseline, reflecting the average emissions intensity of the grid a property draws from.
- Billee's ESG reporting is a byproduct of the utility billing data it already manages, not a separate quarterly data pull.
Why this matters for sustainability leads
Institutional owners and lenders increasingly gate financing, refinancing, and disclosure on ESG reporting, and utility consumption is the largest single input to the environmental score. A portfolio that can't produce clean, defensible consumption data is exposed at the next refinance or investor review, not just behind on a report.
The labor mismatch makes this worse. Most portfolios have one or two people covering sustainability reporting across hundreds or thousands of units, running the same manual pull every quarter or every year for GRESB. That's why ESG data collection gets described as a fire drill instead of a process.
How the pipeline actually works
Stage 1: Inventory every utility account across the portfolio
Before any data gets pulled, a sustainability lead needs a master list of every electric, gas, and water account at every property: which units are submetered, which are RUBS-allocated, and which sit on a straight master meter with no unit-level split. RUBS-allocated consumption is a formula-based estimate, not a measurement, and it needs to be flagged that way, not treated as equivalent to a submeter read.
This inventory is the step most leads let go stale, and it's usually the first thing that breaks the pipeline. A property that added submeters last year but never updated the master list still gets pulled as RUBS-estimated when better data exists.
Stage 2: Collect the raw consumption data
The data comes from four places, and most portfolios run all four at once. Green Button Connect My Data lets a utility customer authorize a third party to pull interval usage data directly, in intervals from one minute to monthly depending on the meter, through utilities that support the NAESB REQ.21 standard. Where a utility doesn't support Green Button, the data comes from a manual login to its own web portal instead.
Submetered properties add a third source: the submeter or AMI feed, separate from whatever the utility reports at the master meter. As of December 2023, 76.8% of U.S. electric meters were AMI-enabled, so most properties already have a smart master meter. That says nothing about whether individual units are submetered or whether that data reaches the sustainability lead automatically. The fourth source, manual paper-bill entry, still shows up wherever neither Green Button nor a submeter feed is available.
Stage 3: Normalize units and validate for gaps
Electricity comes in kWh, gas in therms, water in CCF, and benchmarking tools want everything converted to a consistent basis before they'll touch it. This conversion step is where most manual pipelines actually break, not the data collection itself.
Once units are consistent, the dataset needs to be checked for missing months and implausible reads. GRESB's 2026 standard is explicit that participants must use actual data, with estimation permitted only to fill partial gaps: a maximum of 20% of the reporting period, capped at three months across both reporting years, and never by averaging across assets or applying a prior year's numbers to a current gap. Every estimate has to be disclosed, with the methodology and the reason it was needed.
Stage 4: Benchmark in ENERGY STAR Portfolio Manager
Once the dataset is unit-consistent and validated, it's ready for Portfolio Manager. The Web Services API lets a utility, energy service company, or platform push aggregate whole-building consumption data automatically and get back an ENERGY STAR score, a weather-normalized energy use intensity benchmark, and a carbon emissions estimate. None of that works on data that hasn't already cleared Stage 3, and the property-level ENERGY STAR score is usually the first thing an institutional owner or lender asks for.
Stage 5: Map to the framework and document the trail
GRESB, CDP, and investor-specific ESG questionnaires each want a different cut of the same dataset, and the emissions boundary only needs to be defined once. GRESB's 2026 standard requires Scope 2 emissions reported using the Location-Based method, reflecting the average emissions intensity of the grid supplying the property, as the mandatory baseline. The Market-Based method is optional on top of it.
The last step is documentation, not a spreadsheet export. A defensible submission logs the source, pull date, and method behind every data point, plus the estimation methodology wherever GRESB's estimation rules were used. That log is what a reviewer, auditor, or lender's diligence team actually asks for when they question a number.
At a glance: where portfolio consumption data actually lives
| Source | What it covers | Typical update cadence |
|---|---|---|
| Green Button Connect My Data | Interval usage direct from participating utilities | 1 minute to monthly, meter-dependent |
| Utility company portal (manual) | Non-Green Button utilities | Monthly, pulled by hand |
| Submeter / AMI feed | Unit-level usage on submetered properties | Daily to hourly |
| Master-meter invoice | Whole-building usage with no unit-level split | Monthly, tied to the billing cycle |
| RUBS-estimated allocation | Formula-based estimate, not a direct measurement | Monthly, derived rather than metered |
Common mistakes
- Treating RUBS-allocated consumption as measured data instead of flagging it as an estimate.
- Skipping unit normalization and benchmarking mixed units, which quietly corrupts the ENERGY STAR score.
- Using more estimated data than GRESB's rules allow, or filling a current-year gap with prior-year numbers, both explicitly prohibited under the 2026 estimation rules.
- No audit trail, so a reviewer or lender asking where a number came from gets no documented answer.
- Re-deriving Scope 1, 2, and 3 boundaries from scratch every cycle instead of defining them once.
- Running the portfolio pull manually every quarter with no system tracking what's already been collected.
When to handle this in-house vs. bring in a partner
A sustainability lead covering a single portfolio with consistent submetering and a documented process can run this in-house without much trouble. The math changes once a portfolio spans multiple PMS platforms, a mix of submetered, RUBS-allocated, and master-metered properties, and more than one reporting cadence running at once (GRESB annually, an investor questionnaire quarterly, a lender covenant check on its own schedule). At that point, the work is closer to a data-engineering project than a reporting task, and that's where a partner earns its cost.
How Billee can help
Billee already manages the utility billing data behind every resident charge across a portfolio, so ESG reporting comes out of that same dataset instead of requiring a separate quarterly pull. The platform aggregates consumption across kWh, kBtu, therms, and CCF, keeps RUBS-estimated and submetered data clearly distinguished, and produces output formatted for ENERGY STAR Portfolio Manager and GRESB-style reporting.
That output is only as good as the data underneath it, which is why Billee's meter monitoring and proactive alerts run continuously against the same feeds. A broken meter or a flatlined submeter gets caught before it becomes a reporting-season gap, not after.
FAQ
How do you pull utility consumption data for a whole multifamily portfolio?
Consumption data comes from four places: Green Button Connect My Data where a utility supports it, manual portal logins where it doesn't, submeter or AMI feeds, and manual bill entry as a fallback. A master account inventory has to come first, since most portfolios run all four at once.
What's the difference between consumption data and invoice data for ESG reporting?
Consumption data is what the meter measured, in kWh, therms, or CCF. Invoice data is what got billed, in dollars, and the two diverge the moment a rate changes. ESG frameworks want consumption data, not invoice totals.
Does ENERGY STAR Portfolio Manager accept automated data uploads?
Yes. Its Web Services API lets a utility or platform push whole-building consumption data automatically and receive back an ENERGY STAR score, a weather-normalized energy use intensity benchmark, and a carbon emissions estimate.
How do you handle utility data for properties that use RUBS instead of submetering?
RUBS-allocated consumption is a formula-based estimate, not a direct measurement, and it needs to be flagged that way in the ESG dataset rather than treated as equivalent to a submeter read.
What emissions scope does multifamily ESG reporting typically require?
Scope 2, covering purchased electricity, is the baseline requirement across nearly every major framework touching multifamily. GRESB's 2026 standard requires it reported using the Location-Based method, reflecting the average emissions intensity of the local grid.
How much estimated data does GRESB allow when actual consumption data is missing?
GRESB's 2026 estimation rules cap estimated data at 20% of the reporting period, with a hard limit of three months across both reporting years. Prior-year data can't fill a current-year gap, and consumption can't be averaged across assets.
What counts as defensible ESG data for a GRESB or investor submission?
A defensible dataset logs the source, pull date, and collection method behind every number, along with the estimation methodology wherever estimates were used. A final total with no documentation behind it doesn't hold up to a reviewer's questions.
Does Billee handle ESG reporting automatically or is it a separate request?
Billee's ESG reporting draws from the same utility billing data the platform already manages for a portfolio, so it doesn't require a separate quarterly data-collection cycle.
Related reading
- ESG & Sustainability Reporting
- How Multifamily Operators Build ESG Reports from Utility Data
- What a CFO Needs from Utility Reporting
- How Submeter Data Is Collected and Reported
Portfolio-wide ESG data collection doesn't have to be a quarterly fire drill run out of a spreadsheet. Talk to the Billee team about how this works for your portfolio.
Sources
- Green Button Alliance, "Green Button Connect My Data (CMD)," accessed 2026.
- U.S. Environmental Protection Agency, "ENERGY STAR Portfolio Manager Web Services," accessed 2026.
- GRESB, "Data Estimation Rules, 2026 Real Estate Assessment," accessed 2026.
- GRESB, "GH1: Scope 1-3 Emissions, 2026 Real Estate Assessment," accessed 2026.
- Federal Energy Regulatory Commission, "2025 Assessment of Demand Response and Advanced Metering."
Insights and Industry Trends


Explore more insights