How Multifamily Operators Use Utility Data for Budget Forecasting
Utility expenses represent 20–35% of total operating expenses in a multifamily property, making them one of the largest and most volatile line items in the annual operating budget. Unlike insurance premiums or management fees, utility costs vary with three factors the operator does not control: season, occupancy, and rate schedule decisions made by municipal providers outside the budget cycle. Operators who rely on prior-year actuals alone consistently produce utility budget lines that miss rate increases, fail to normalize consumption anomalies, and leave vacant unit costs either over- or under-estimated. Billee's Utility Vendor Management product centralizes historical invoice data, rate schedules, and consumption trends across the portfolio, giving operators the data foundation that accurate utility budget forecasting requires.
Key Takeaways
Per the NAA Income/Expense Survey, utilities represent 20–35% of total operating expenses in multifamily, varying by property type and metering structure.
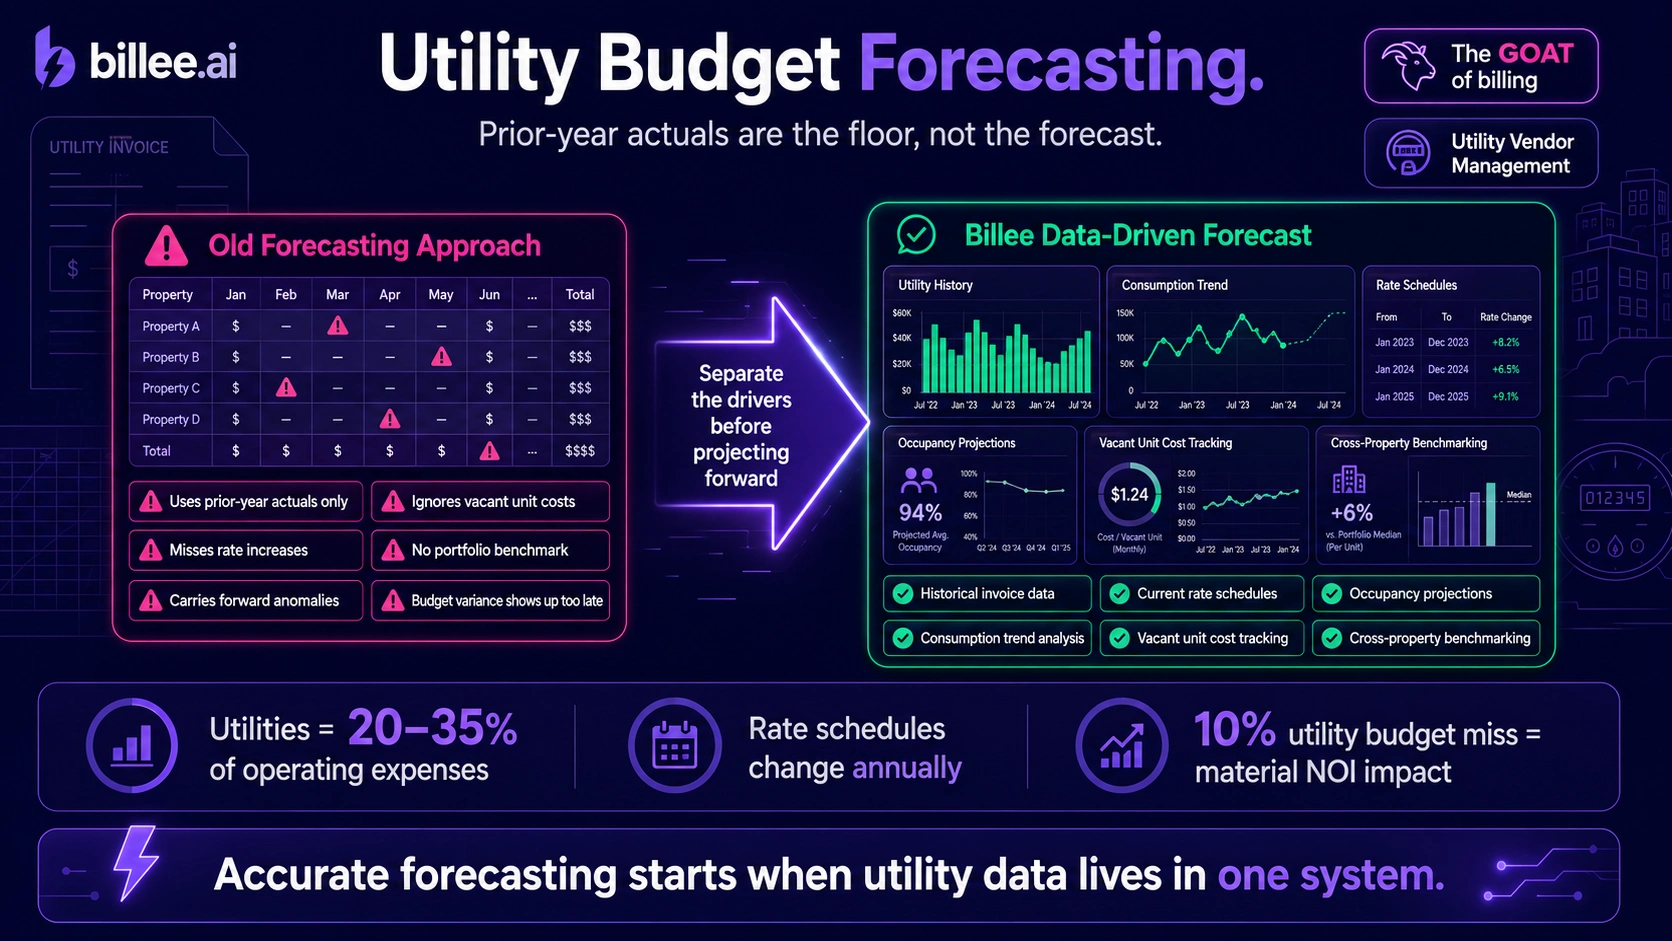
Prior-year actuals are the floor for utility forecasting, not the forecast itself: they embed rate changes, consumption anomalies, and occupancy effects that must be separated before projecting forward.
Municipal utility rate schedules change at least annually. An operator building next year's budget using this year's rate is building in a known error before the year starts.
Consumption anomalies, such as a Q2 water spike from a repaired leak, inflate the prior-year baseline and distort next year's forecast unless identified and normalized.
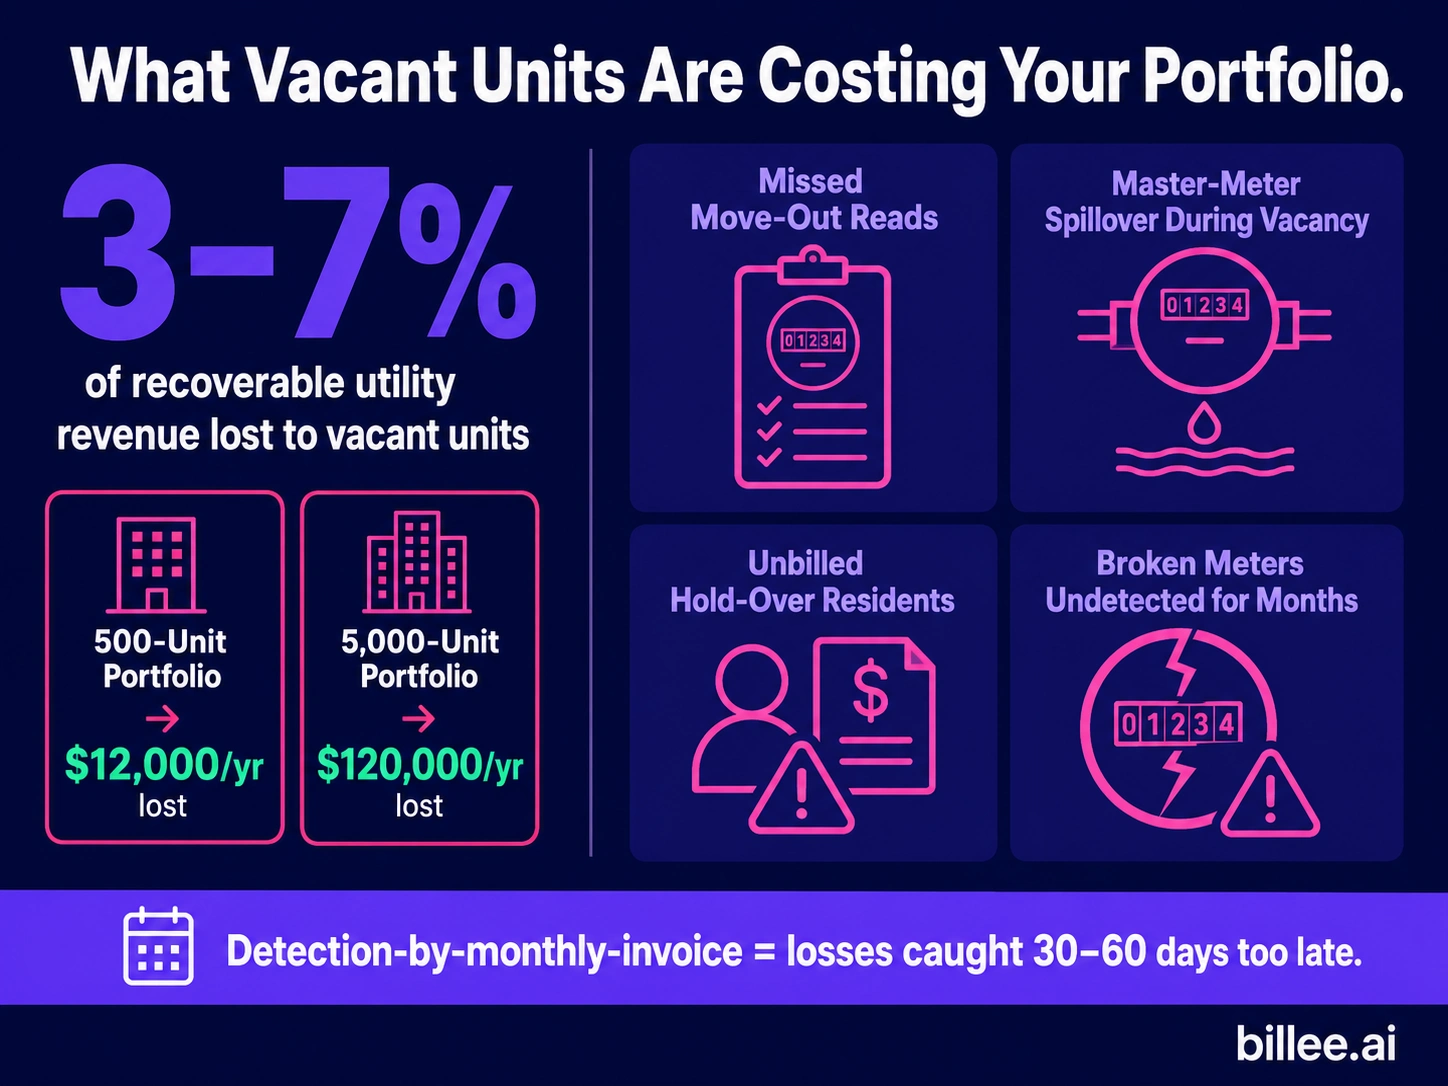
Vacant unit utility costs in master-metered or bulk-billed properties require their own projection methodology; operators without tracking either over-budget or ignore the line entirely.
Portfolio-level utility data enables cross-property benchmarking that reveals which properties are running above benchmark on water or below on electric, a sanity check that property-by-property extrapolation cannot provide.
Why Utility Expenses Are the Hardest Operating Line to Forecast
Most line items in a multifamily operating budget are relatively predictable before the year starts. Insurance premiums are negotiated and known. Management fees are a fixed percentage of collected revenue. Payroll is a known baseline with known escalation. Utilities are different because they vary with factors outside the operator's control: season (HVAC load), occupancy (consumption volume), and rate schedule decisions made by municipal providers that may take effect at any point in the year.
Per the NAA Income/Expense Survey, utilities represent roughly 20–35% of total operating expenses across multifamily property types, depending on metering structure and which utility types the owner pays directly. That share is large enough that a 10% miss on utility expense, which is common for operators without granular data, produces a material NOI impact at the property level and compounds across a portfolio.
Reducing utility budget variance is not a matter of applying a better escalation percentage to last year's actuals. It requires better underlying data.
The Four Inputs That Drive Accurate Utility Budget Forecasting
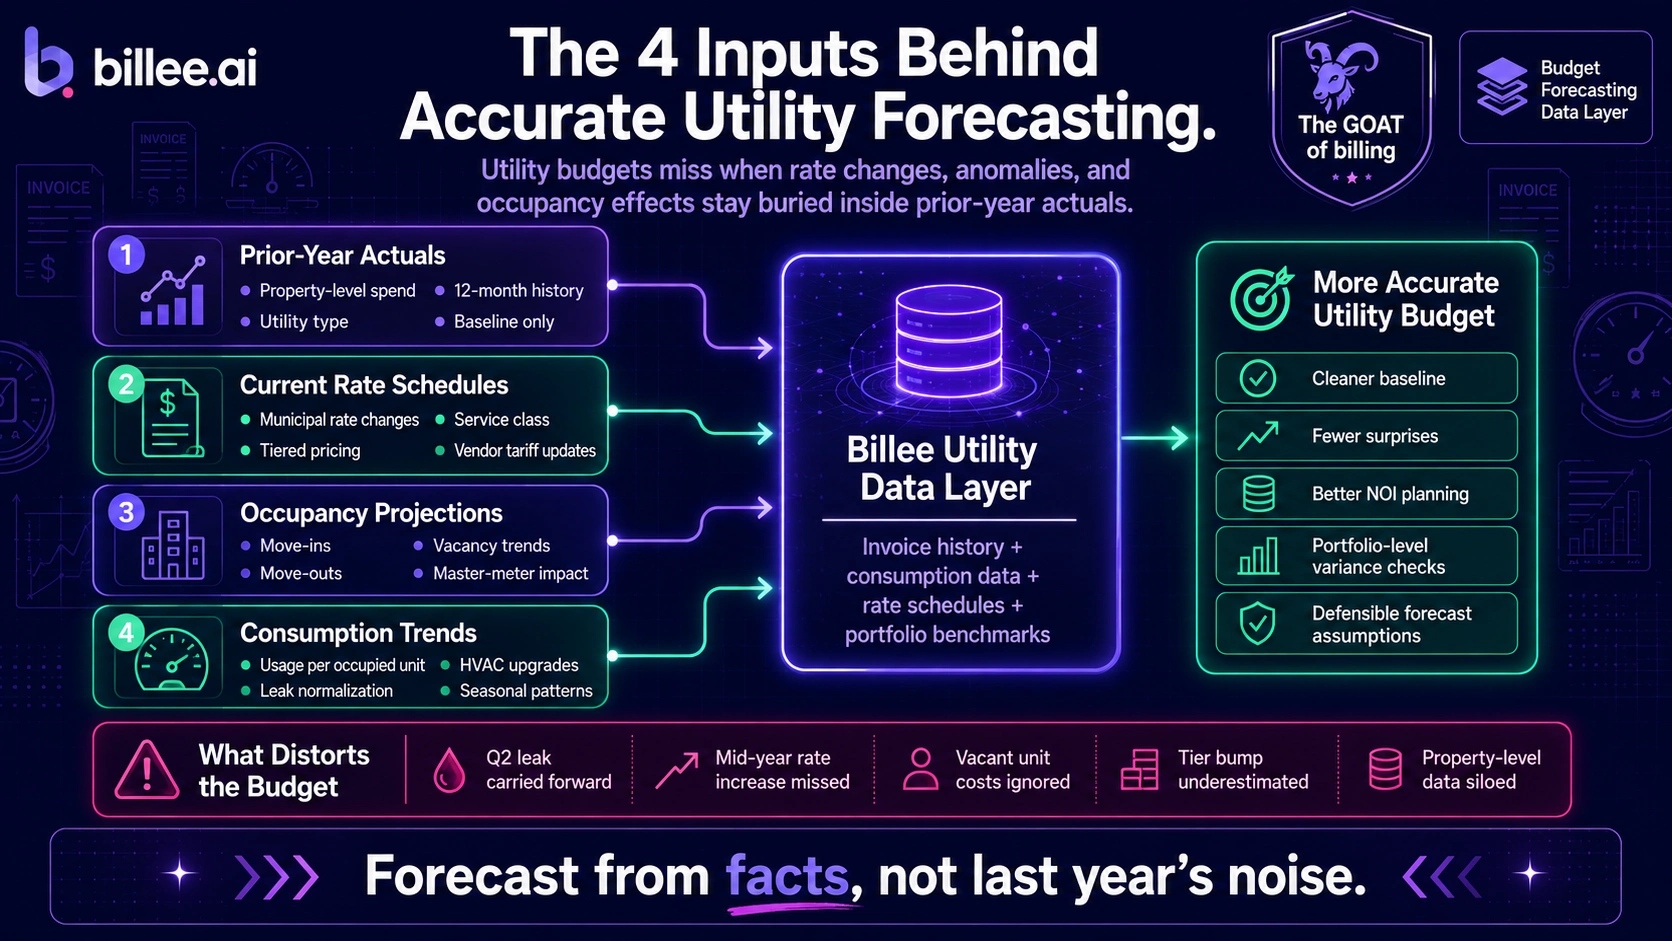
Accurate utility expense forecasting is built from four inputs, each requiring its own data source and its own update logic for the budget year.
Prior-year actuals are the baseline: what the portfolio actually spent, by property and utility type, over the prior 12 months. Actuals are the starting point, not the answer. They need to be adjusted for rate changes, consumption trend shifts, and any anomalies that inflated or deflated specific line items in the prior period.
Current rate schedules are what the vendor will charge per unit of consumption in the coming period. For portfolios with multiple utility types across multiple jurisdictions, rate schedules vary by provider, property class, and service level. Applying last year's rate schedule to a consumption projection builds in a known error before the budget year begins.
Occupancy projections affect consumption volume in master-metered or bulk-billed properties. A portfolio projecting 95% average occupancy versus 88% will see different water and electric consumption volumes, independent of any rate changes. Occupancy projections also drive the vacant unit cost variable, which requires its own line in any master-metered property budget.
Historical consumption trends capture whether a property is using more or less per occupied unit over time, independent of rate. A property with aging water infrastructure may show a 3–4% annual increase in consumption per unit. A property that completed a HVAC upgrade in the prior year may show a step-down in electric consumption that will persist going forward. Trend data changes the forward forecast even when actuals appear flat.
Rate Schedule Changes: The Forecasting Input Most Often Missed
Municipal utility rate schedules change at least annually, and many providers implement mid-year adjustments tied to regulatory filings, infrastructure bond obligations, or drought surcharges. An operator building next year's water budget using this year's rate schedule is incorporating a known error before the budget year begins.
Rate increases of 5–15% are common at municipal water providers in high-growth and drought-affected markets. Tiered rate structures amplify the impact: if a rate increase moves a property's average monthly consumption from one tier into the next, the effective per-unit cost rises more than the base rate change alone would suggest. A 10% rate increase combined with a tier-bump can produce an 18–22% increase in the actual invoice amount for the same consumption volume.
The practical challenge is that rate schedule changes are not communicated to property teams as notifications. They appear in the invoice. Without a system that compares current invoice rates against the last known rate schedule for that account, rate changes are discovered at month-end reconciliation, not at budget time. As Zego documents in its analysis of utility accounts payable practices, misapplied rate structures are among the most common and persistently missed error categories in multifamily utility AP, precisely because rate schedules are rarely checked against the tariff on file. The same gap that produces billing errors during invoice processing produces budget variance during forecasting.
Consumption Anomalies as Budget Signals
A water main leak repaired in Q2 does not just affect Q2 actuals. It inflates the prior-year baseline used as the starting point for next year's forecast. If the anomaly is not identified and normalized, the budget assumes it will recur. A property that spent $18,000 on water in the prior year, including $4,000 from a Q2 leak, gets an $18,000 baseline, plus escalation, for a budget line that should start at $14,000.
The same logic works in reverse. A property that installed low-flow fixtures in September of the prior year will show only a partial-year savings in actuals. The prior-year baseline understates the forward projection because the full-year benefit does not appear until the current year has run. Budgeting from unanalyzed actuals produces a water line that is too conservative and absorbs a favorable variance that was already banked.
Both of these require consumption-level data, not just invoice totals. Reviewing only dollar amounts, an operator sees "water was high in Q2." With consumption data, the operator can confirm that Q2 was a usage anomaly rather than a rate error, quantify it, and exclude it from the baseline. The consumption data Billee captures during the invoice audit process is the same data that makes next year's forecast more accurate: distinguishing normal consumption from anomalous consumption requires the underlying usage figures, and those figures serve both audit and budget functions simultaneously.
Vacant Unit Utility Costs: The Budget Line That Gets Missed
In master-metered or bulk-billed multifamily properties, vacant unit utility costs are part of total utility expense. How much those costs run depends on unit turn time, the average number of vacant units in each month, and what the operator maintains between tenancies, including HVAC setpoints, water shutoffs, and lighting.
Operators without a system for tracking vacant unit consumption separately tend toward one of two errors. They over-budget by applying occupied-unit consumption rates to the total unit count, which overstates expense in periods of elevated vacancy. Or they under-budget by treating vacant unit costs as negligible and applying prior-year actuals without separating the occupancy-driven component, which understates expense in slow-lease periods.
At a 500-unit portfolio running 8% average vacancy across the year, the untracked vacant unit utility cost is a six-figure budget variable. It requires its own projection: average vacant unit count by quarter, multiplied by average per-unit consumption for a non-occupied unit, at the current rate schedule. For portfolios with a Vacant Cost Recovery program, the same consumption tracking that drives recovery calculations is the data that makes the vacant unit utility budget line accurate.
Portfolio-Level Data vs. Property-Level Data
When utility data is managed at the property level, each property manager has visibility into their own history. What no one has is the cross-property picture: how any individual property's utility spend compares to comparable properties in the same portfolio and climate zone.
Portfolio-level data enables benchmarking: average cost per unit per month, by utility type, across comparable properties. A property running 30% above the portfolio benchmark on water per occupied unit is a candidate for a consumption audit, a leak investigation, or a rate schedule review. A property running consistently below benchmark on electric may have underreported occupancy or a metering gap that will surface as a catch-up invoice. Neither pattern is visible from the property level alone.
At budget time, portfolio benchmarks provide a sanity check that property-by-property extrapolation from actuals cannot. A property whose actuals imply 15% water cost growth next year, against a portfolio average of 5%, is worth scrutinizing before that number enters the budget. Quadient's research on AP automation documents that automated AP workflows save more than 70% of the time teams spend on accounts payable; the budget forecasting parallel is that centralized data creates the portfolio-level visibility that makes those cross-property checks possible in the first place.
How Billee Provides the Utility Data Layer for Budget Forecasting
Billee consolidates historical invoice data, consumption figures, and rate information for every enrolled utility vendor across the portfolio. The customer portal at app.billee.ai provides a current-period view of every statement due and a historical view of every processed invoice by property and utility type, updated as invoices are received and audited.
At budget season, the historical data in Billee's platform becomes the foundation for utility expense projections. Prior-year actuals by property and utility type, consumption trend data, and rate schedule information are available in one system rather than assembled from vendor portals, property-level spreadsheets, and emails from staff who handled those accounts in prior years. The invoice audit step that Billee runs on every incoming invoice, checking amounts against rate schedules and consumption against prior-period history, generates the consumption-level data that forecasting requires as a byproduct of the normal AP workflow.
For operators managing 20 properties or 200, the data layer is the same. The full utility vendor management process includes credential management, invoice tracking, and AP posting, all of which produce the historical record that utility budget forecasting draws from. For teams that want to understand how the invoice-level data is captured, the AP automation article and the portfolio invoice management overview cover those mechanics in detail.
Implementation takes 45 days. Vendor onboarding, rate schedule configuration, and PMS integration are handled by the Billee team.
Billee centralizes utility invoice history, consumption data, and rate schedules for multifamily portfolios that want to forecast from facts rather than estimates. See how it works for your portfolio.
FAQ: Utility Data and Budget Forecasting for Multifamily
What percentage of multifamily operating expenses are utilities?
Utilities typically represent 20–35% of total operating expenses in multifamily, per the NAA Income/Expense Survey, with the range varying based on whether the property is master-metered or submetered and how many utility types the owner pays directly. Master-metered properties with owner-paid electric, water, gas, and trash will land at the higher end of that range.
What data do I need to forecast utility expenses accurately?
Accurate utility budget forecasting requires four inputs: prior-year actuals by property and utility type, current rate schedules for each vendor and service class, occupancy projections by quarter, and historical consumption trends. Actuals alone are insufficient because they embed rate changes, consumption anomalies, and occupancy effects that need to be separated before projecting forward.
How do utility rate changes affect multifamily budget forecasting?
Rate schedule changes at municipal utility providers, often 5–15% annually in high-growth and drought-affected markets, directly increase the per-unit cost of consumption independent of how much the property uses. Tiered rate structures amplify this: if a rate increase moves a property's consumption into a higher tier, the effective cost per unit increases more than the base rate change alone. Operators who build budgets using current-year rates without adjusting for known or anticipated changes systematically under-budget utility expenses.
How do I account for vacant unit utility costs in my operating budget?
Vacant unit utility costs in master-metered properties should be projected separately from occupied-unit costs, using average vacant unit count by quarter, estimated per-unit consumption for non-occupied units, and the current rate schedule. Applying occupied-unit consumption rates to the total unit count overstates expense; ignoring vacant unit costs understates it, particularly in quarters with higher-than-average turnover.
How does portfolio-level utility data improve budget accuracy?
Portfolio-level utility data enables cross-property benchmarking, identifying which properties are running above or below comparable properties on any utility type, and variance sanity checks that flag properties whose forecast growth rate deviates significantly from the portfolio average. Both of these reduce the risk of carrying forward anomalies, errors, or above-benchmark consumption into the next budget year without scrutiny.
Sources
National Apartment Association, "Income & Expense Survey," accessed June 2026. (Documents utilities as a percentage of total multifamily operating expenses by property type.)
Zego, "The Top 3 Utility Accounts Payable Mistakes Multifamily Companies Make," 2025.
Quadient, "Accounts Payable Automation by the Numbers: 10 Statistics to Know," September 2024.
Insights and Industry Trends