

Multifamily Utility Management Statistics and Industry Trends 2026
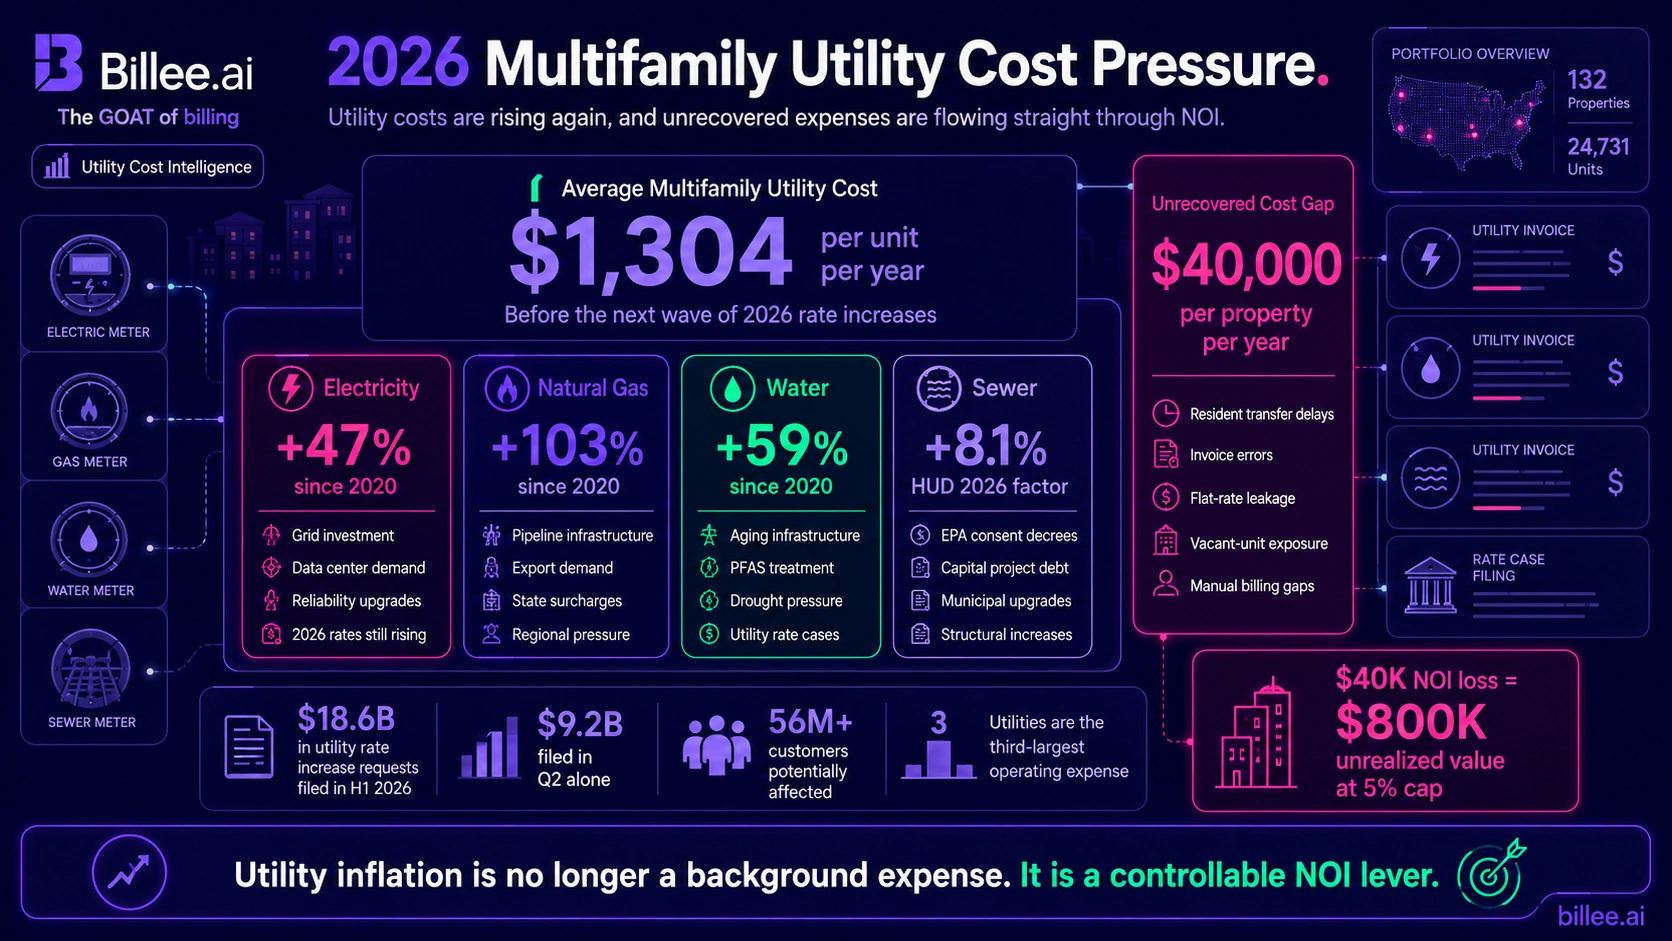
Utilities cost the average multifamily property $1,304 per unit per year — and that benchmark was set before electricity rates climbed further in 2026, water and sewer costs rose again, and U.S. utilities filed a record $18.6 billion in rate increase requests in the first half of the year alone. Electricity is up 47% since 2020. Natural gas is up 103%. Water is up 59%.
Most operators are absorbing costs that should be recovered: industry surveys put unrecovered resident utility expenses at $40,000 per property per year on average. The operators closing that gap are doing it with submetering, proactive billing management, and smart technology — and in 2026, those tools are moving from competitive advantage to operational baseline.
Key Takeaways
- $1,304 per unit per year is the 2024 NAA benchmark for total multifamily utility costs across more than 4,600 properties and 1 million units. Water and sewer alone increased 5.1% year-over-year in 2024. *(NAA 2024 Income/Expense IQ, IREM/BOMA)*
- U.S. utilities filed $18.6 billion in rate increase requests in H1 2026, including a record $9.2 billion in Q2 alone — surpassing the prior Q2 record by 26%. *(PowerLines)*
- Electricity is up 47% since 2020. Natural gas is up 103%. Water is up 59%. These are not short-term spikes. *(EIA; PowerLines)*
- HUD's FY2026 utility allowance factors — effective February 11, 2026 — reflect national weighted average increases of +6.8% for electricity, +9.2% for natural gas, +7.4% for water, and +8.1% for sewer. *(Conduit Labs; HUD)*
- Residents who pay for water consume up to 39% less than those whose water costs are included in rent. A Guidehouse study of 1,500 submetered units found a 40% reduction in monthly electricity use per unit in year one. *(NAA/NMHC; Guidehouse via NAA)*
- 56.4% of renters say unclear or unexpected fees would prompt a negative review — the highest reason tested. Utility billing practices ranked third in what residents expect landlords to be transparent about. *(SatisFacts 2025 Biennial Online Renter Study)*
- 94% of multifamily operators are implementing AI or planning to within 12 months. Of those already using AI, 77% report reduced operating expenses. *(EliseAI 2026 Executive Survey via Frontdesk Research)*
Utility Cost Increases: 2020–2026
| Utility Type | 5-Year Increase (2020–2025) | 2026 HUD Factor Adjustment (National Avg) | Primary Driver |
|---|---|---|---|
| Electricity | +47% | +6.8% | Grid investment; data center demand surge |
| Natural gas | +103% | +9.2% | Pipeline infrastructure; export demand; state surcharges |
| Water | +59% | +7.4% | Aging infrastructure; federal PFAS treatment mandates |
| Sewer | — | +8.1% | EPA consent decrees; capital project debt service |
Sources: EIA; PowerLines; Conduit Labs analysis of HUD FY2026 Annual Adjustment Factors (effective February 11, 2026)
What Utilities Actually Cost Multifamily Operations
The Benchmark: $1,304 Per Unit Per Year
The National Apartment Association's 2024 Income/Expense IQ report — covering more than 4,600 properties across 109 metropolitan markets and over one million units, published in partnership with IREM and BOMA — put total owner-absorbed utility costs at $1,304 per unit per year. That translates to roughly $108 per unit per month before the rate increases that have since been approved and filed.
The 2024 figure reflected a 3.2% overall decline from the prior year, driven by a pullback in heating fuel and natural gas commodity prices. That decline is an anomaly in an otherwise sustained upward trend. Water and sewer costs increased 5.1% year-over-year even in 2024, and the rate pipeline entering 2026 points sharply upward across every utility category.
Utilities as the Third-Largest Operating Expense
Utilities consistently rank as the third-largest operating expense for multifamily properties, behind debt service and payroll. For a property with 300 units, $1,304 per unit per year means over $390,000 annually in owner-absorbed utility costs before any cost recovery. That figure grows every time a rate increase clears a state PUC — and in 2026, dozens have.
The split between owner-paid and resident-paid utilities varies by utility type. Natural gas is roughly evenly split between owner-absorbed and resident-billed in the national multifamily stock. Electricity skews toward resident-paid in newer construction and toward owner-absorbed in older master-metered buildings. Water and sewer remain predominantly owner-absorbed, which is why water is where cost recovery programs generate the most immediate financial return.
HUD FY2026 Adjustments: A Forward Indicator for All Operators
HUD publishes annual utility allowance adjustment factors for its assisted housing programs, and those factors reflect actual market rate changes at the metropolitan statistical area level. The FY2026 factors — effective February 11, 2026, following publication in December 2025 — show national weighted average increases of 6.8% for electricity, 9.2% for natural gas, 7.4% for water, and 8.1% for sewer. Per Conduit Labs' analysis, some two-bedroom unit allowances in high-cost markets increased by $30 to $50 per month.
These figures matter to market-rate operators because they reflect what is actually happening to utility rates in the market, not just in assisted housing. The same rate cases that drove HUD's factor increases are flowing through to master meter bills at market-rate properties across the same metropolitan areas.
The 2026 Rate Environment: $18.6 Billion in Pending Increases
A Record Quarter for Rate Filings
U.S. utilities filed $18.6 billion in electric and gas rate increase requests during the first half of 2026, according to PowerLines' Q2 2026 quarterly index. The second quarter alone accounted for $9.2 billion in new filings, surpassing the previous Q2 record by 26%. The filings from Q2 alone could affect future bills for more than 56 million U.S. utility customers.
Rate increase requests are not immediate. They move through state PUC proceedings before taking effect. But the pipeline of approved and pending increases entering the second half of 2026 will flow through to operator bills over the next 12 to 24 months, compounding what operators are already absorbing.
Electricity: +47% Since 2020, Continuing to Rise
U.S. residential electricity prices increased approximately 47% between 2020 and 2025, according to U.S. Energy Information Administration data. In 2026, national rates are climbing an additional 4.2% on average, with some regions seeing increases above 10%. The primary drivers — grid hardening investments, extreme weather reliability costs, and surging electricity demand from data centers — are structural, not cyclical. None of them are expected to reverse in the near term.
The Conduit Labs analysis of HUD factors found that electricity factor increases exceeded 12% in some metropolitan markets, concentrated in the Mid-Atlantic PJM territory, Texas ERCOT, and Southeast markets where Florida and Texas utilities completed rate base adjustments for grid modernization and hurricane hardening.
Natural Gas and Water: Structural, Not Temporary
Natural gas prices more than doubled between 2020 and 2025, with a five-year increase of approximately 103%. Pipeline infrastructure costs, increased liquefied natural gas export demand, and state-level clean energy surcharges are the primary contributors. Northeast markets saw sustained natural gas factor increases of 10 to 14% in 2026 HUD filings.
Water has been the most underestimated cost category. A 59% increase over the same five-year period, driven by aging infrastructure replacement and federal PFAS treatment compliance costs, has outpaced many operators' budget assumptions. Per PowerLines, many water utilities won sizable rate cases in 2025, setting up significantly higher bills in 2026. EPA consent decrees for water system upgrades are creating multi-year structural cost pressure in major markets including Atlanta, Houston, and Philadelphia.
The Cost Recovery Gap: What Operators Are Leaving Behind
$40,000 Per Property Per Year in Unrecovered Costs
Industry surveys consistently put the average annual amount of utility expenses absorbed by multifamily operators that belong to residents at approximately $40,000 per property. The sources of this leakage are not mysterious: residents who don't transfer utilities promptly at move-in, common area costs buried in flat-rate allocations, and invoice errors that go undetected in manual billing workflows. Each category is recoverable with the right systems in place.
Utilities that are absorbed rather than billed back are not just a direct expense. Each dollar of unrecovered utility cost reduces NOI directly. At a 5% capitalization rate, $40,000 in annual NOI lost to unrecovered utility costs represents $800,000 in property valuation that is not being realized. As a February 2026 utility billing analysis explains, utilities shift from being a drag on NOI to a controllable financial lever when they are allocated consistently and recovered systematically.
Vacant Utility Billing: 1 in 4 Residents Doesn't Transfer on Time
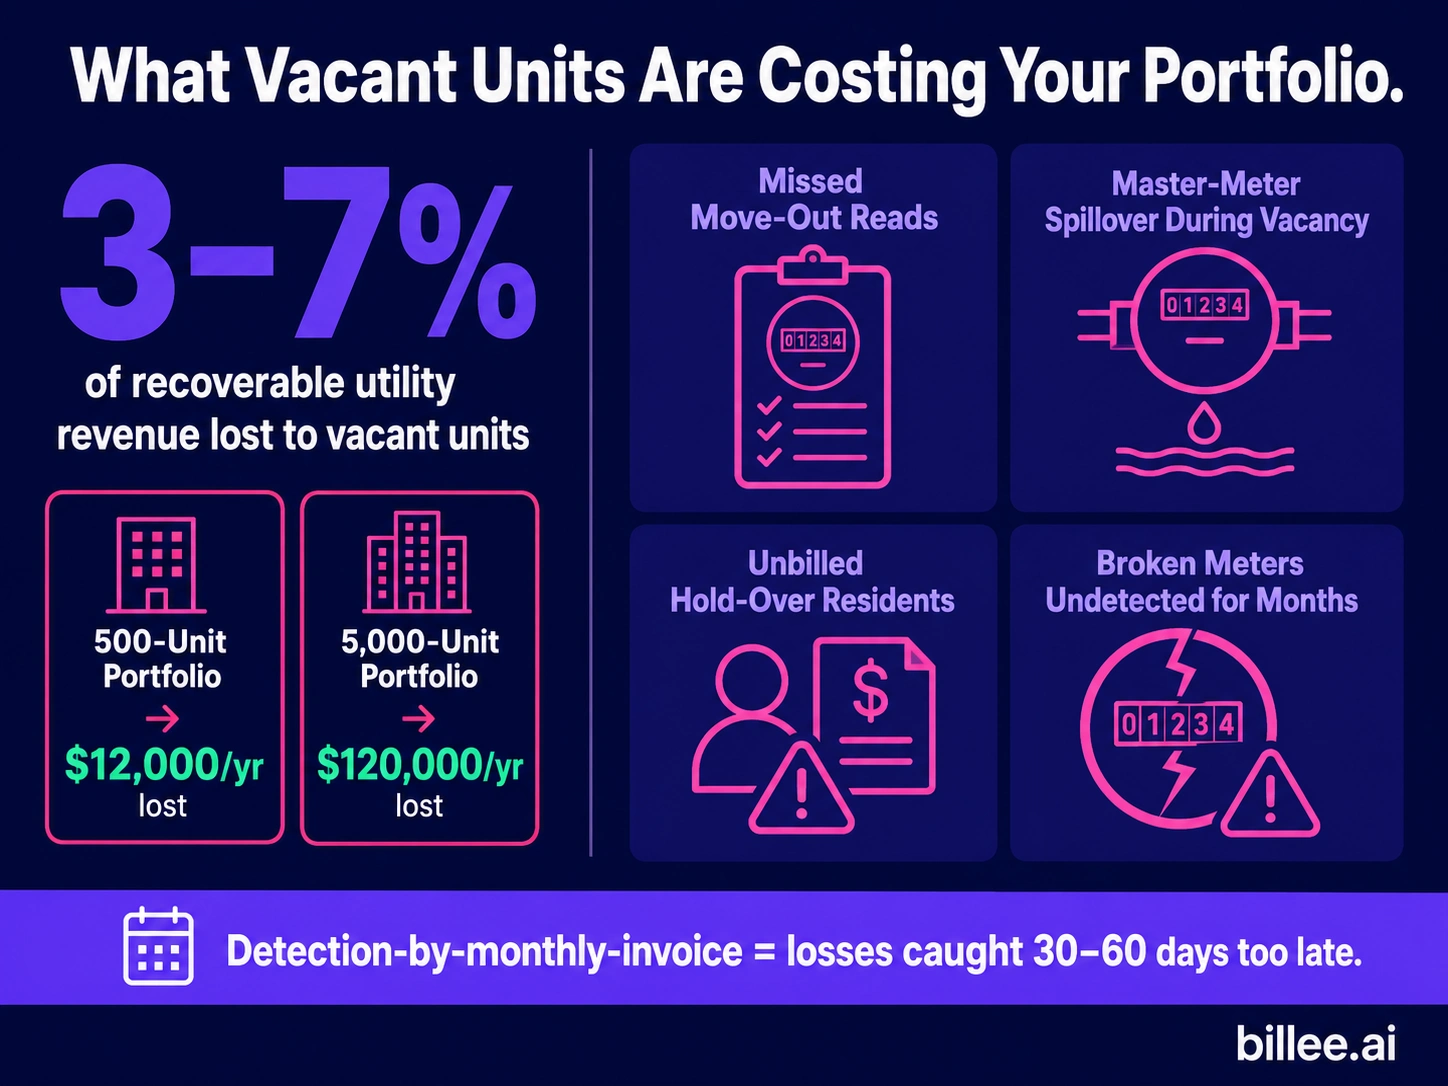
Approximately one in four residents delays transferring utility accounts into their name after move-in. In practice, 20 to 40% of new move-ins don't arrange utility transfers in time, leaving the master meter billed to the property for a period when a resident is occupying and consuming. This is commonly called vacant cost recovery (VCR), though the unit is not always empty — the utility account is vacant of a resident's name while the resident is present.
Approximately half of multifamily operators do not actively perform vacant cost recovery at all, according to industry estimates. For a 300-unit property with 40% annual turnover and a 30-day average gap per move-in, the exposure is material and recurring. VCR is one of the highest-return billing programs available to multifamily operators precisely because the cost of implementing it is low relative to the recovery it generates.
Invoice Errors: A Recurring Leak in the Pipeline
Utility provider invoices contain errors more often than most operators realize. Misread meters, incorrect rate schedule applications, duplicate charges, and billing period errors appear in master meter invoices across all utility types. Without automated invoice auditing — comparing each bill against usage data, rate schedules, and prior-period history — these errors accumulate undetected through the billing cycle and into the property's operating expense.
The financial impact compounds across a portfolio. A rate schedule misapplication on a 200-unit property may cost $500 to $2,000 per billing period and persist for months before it surfaces in a reconciliation. Automated billing platforms that cross-reference invoices against usage data catch these errors at the point of receipt, not after the check has cleared.
Billing Method Performance in 2026
How Operators Are Currently Billing: 48% Still Using Flat Rate
A survey of 608 multifamily professionals found that 48% charged residents a flat monthly rate for utilities in 2025. Flat-rate billing provides zero recovery for variable cost increases. Every rate hike approved by a PUC flows directly into the property's operating expense with no offset from the resident side. In a year when utilities have filed $18.6 billion in new rate increase requests, flat-rate billing is the most expensive methodology an operator can choose.
The remaining multifamily stock uses ratio utility billing systems (RUBS), submetering, or hybrid models. Each has a different recovery rate, conservation impact, and compliance profile. The choice of billing methodology is not a back-office decision — it is one of the most consequential financial decisions an operator makes for a property.
Recovery Rate Benchmarks by Billing Method
Submetered water programs targeting best-practice performance should achieve 85 to 95% recovery of the master meter bill. Submetered electricity programs should reach 95% or higher. Submetered gas programs typically target 90% or above. RUBS programs, which allocate costs without individual measurement, typically recover 70 to 85% after accounting for common area exclusions and allocation methodology constraints. In-rent and flat-rate billing recover 0% of variable cost increases.
A case study of a 450-unit multifamily retrofit analyzed independently and published by the National Apartment Association found NOI increases of $276,000 from electricity submetering and $180,000 from water submetering, producing a total property valuation increase of $5.5 million at a 5% capitalization rate. Per the NAA analysis, submetering not only mitigates emissions but directly controls operating expenses against rising utility costs.
The Conservation Multiplier: Residents Who Pay, Conserve
The financial return on utility billing programs is not limited to cost recovery. When residents can see a direct connection between their usage and their bill, consumption declines. This reduction in usage lowers the master meter bill, which reduces the base cost that the operator absorbs or allocates. Cost recovery and conservation are additive, not competing outcomes.
A landmark study commissioned by the National Apartment Association and the National Multi Housing Council, examining 32 properties across California, Texas, and Florida, found that residents who pay for water consume up to 39% less than residents whose water costs are included in rent. Median submetered properties used 18 to 39% less water than in-rent properties. Median RUBS properties used 20 to 27% less. The full study is available through the Utility Management and Conservation Association.
Water: The Fastest-Rising Cost and the Largest Recovery Opportunity
The 59% Price Surge — and It's Not Slowing
Water and sewer costs increased approximately 59% between 2020 and 2025, making water the most sustained cost increase in the multifamily utility basket. HUD's FY2026 factors show continued upward pressure: national average water factor increases of 7.4% and sewer increases of 8.1% in 2026. Markets with EPA consent decree compliance requirements — including major cities across the Southeast and Mid-Atlantic — are seeing double-digit increases.
The drivers of water cost inflation are structural: aging distribution infrastructure requiring capital replacement, federal PFAS drinking water treatment standards requiring expensive upgrades, and drought-related rate adjustments in Western markets. None of these cost pressures are reversible on short timelines. Operators managing master-metered properties with water absorbed in the base rent are absorbing every one of these increases without a cost recovery mechanism.
What Metering Does to Consumption
The NAA/NMHC water conservation study findings are consistent with more recent data. A Guidehouse study (formerly Navigant Consulting), conducted independently for a submetering provider and cited in a 2024 National Apartment Association analysis, examined 1,500 submetered units and found an average monthly electricity decrease of 139 kWh per unit in the first year of submetering — a 40% reduction. The conservation effect is behavioral: it does not require capital investment in building efficiency and occurs immediately after the billing transition.
The implication for operators is significant. A property that reduces per-unit water consumption by 25 to 39% through a metering program is not only recovering costs from residents — it is also reducing the master meter bill, which reduces the base cost that needs to be recovered or absorbed. Conservation compounds the financial return of any submetering investment.
Smart Leak Detection: Early Warning as a Financial Tool
Undetected water leaks are one of the highest-cost operational risks in multifamily. A single slow leak — a running toilet, a failing irrigation valve, a pinhole pipe failure — can consume tens of thousands of gallons before it registers in a quarterly usage review. Advanced metering and smart leak detection sensors monitor usage continuously, flagging anomalies within hours rather than weeks. Properties implementing smart water metering systems report 20 to 25% reductions in water usage, according to industry benchmarking data, driven by a combination of conservation behavior and early leak intervention.
The payback period on smart water meter installations averages two to four years across the multifamily sector. A 2025 study published in Science Direct found that households using smart meters with consumption feedback reduced daily water use by 6.2% compared to control groups. For a master-metered property absorbing $100,000 annually in water and sewer costs, even a 10% reduction through metering and behavioral change represents $10,000 per year in avoided expense — before any cost recovery is layered on top.
Technology and AI: Adoption Rates in 2026
94% of Operators Are Implementing AI
AI adoption in multifamily has crossed the chasm. Frontdesk Research's 2026 State of AI in Multifamily Housing report, citing EliseAI's 2026 multifamily executive survey, found that 94% of multifamily operators are implementing AI or planning to within the next 12 months — up from approximately 60% in 2024. Among operators with active AI deployments, 77% report moderate to significant reductions in operating expenses, and 85% report increased lead-to-lease conversion rates.
In utility management, AI applications include automated invoice auditing, usage anomaly detection, and billing accuracy verification. Systems that continuously monitor invoices against usage data, rate schedules, and prior-period history reduce human error and catch provider billing mistakes at the point of receipt. Portfolio-level dashboards that aggregate usage, rates, and trends across multiple properties are replacing the reactive monthly reviews that characterized utility management even five years ago.
From Reactive Reporting to Proactive Monitoring
The defining shift in utility management technology for 2026 is the move from reactive to proactive. Historically, utility expense reviews happened after problems surfaced in operating reports. By the time anomalies appeared, the expense was already incurred. Leading operators are now running portfolio-level monitoring systems that flag usage spikes, invoice discrepancies, and rate changes in real time, allowing intervention before costs accumulate.
Rate and tariff optimization is gaining traction as a complementary discipline. Many properties remain on outdated rate schedules — service classifications established years ago that no longer reflect the property's actual load profile, demand characteristics, or time-of-use patterns. A rate review that identifies a more favorable tariff structure generates ongoing savings without capital investment or resident disruption. Industry analysis of 2026 utility management trends notes that rate reviews are increasingly treated as a component of routine asset oversight rather than a one-time exercise.
Automation and the Billing Accuracy Imperative
Manual utility billing processes — spreadsheet reconciliations, one-off invoice reviews, paper-based workflows — are not sustainable at portfolio scale. Each manual step is a point of failure. A transposition error in an allocation calculation, a missed vacant unit in a RUBS run, or an unreviewed provider invoice all translate directly into either overbilling (creating lease dispute exposure) or underbilling (leaving recovery on the table). Automated billing platforms with built-in audit trails eliminate these failure points and produce documentation that supports both compliance reviews and transaction due diligence.
Resident Expectations: What the 2025 Data Shows
56.4% Would Leave a Negative Review Over Unclear Fees
The SatisFacts 2025 Biennial Online Renter Study — a nationally representative survey of renters — found that 56.4% of residents say unclear or unexpected fees would prompt a negative review. That is the highest-rated negative review trigger of any reason tested in 2025, and it has risen from prior survey waves. "Information on mandatory fees beyond the advertised rent" ranked first in content that prospective residents expect to see on community websites and listings, scoring 4.64 out of 5.
Utility billing practices ranked third — at 64.8% — in what residents expect landlords to be transparent about. This is the first year the SatisFacts survey measured utility billing transparency as a standalone item, and it entered the ranking in the top three. The data point reflects a shift: residents are not asking whether utilities are included in rent. They are asking to see exactly how utility charges are calculated and what they are paying for.
The Gap Between Expectation and Delivery
The same SatisFacts study found that 15.1% of residents were not informed of all charges and fees before signing — exactly the group most likely to feel blindsided and post negative reviews. That number has improved from 22.9% in 2023, but 15.1% of a property's move-ins experiencing a fee surprise each year is a meaningful, recurring reputation risk. At a 300-unit property with 40% annual turnover, that is approximately 18 residents per year entering a lease with unresolved charge confusion.
The operational cost of fee disputes — service tickets, staff time, write-offs, and review responses — is difficult to quantify precisely but compounds across a portfolio. Properties that provide itemized billing with clear calculation methodology before and after move-in consistently see fewer disputes, faster dispute resolution, and stronger renewal rates than those that do not.
Transparent Billing as the 2026 Minimum Standard
Transparent utility billing is no longer a competitive differentiator in multifamily. It is the minimum standard residents expect and regulators are increasingly requiring. Colorado, Washington, Virginia, Maryland, and Connecticut have all passed or enacted new utility billing disclosure requirements in the past 18 months. Residents in those markets now have legally defined rights to see how their charges are calculated before they sign a lease. Where the law leads, resident expectations follow across markets where legislation has not yet arrived.
ESG and Benchmarking: The Mandatory Reporting Horizon
Multifamily's Share of U.S. Residential Energy Consumption
Multifamily buildings account for an estimated 23% of U.S. residential energy consumption, according to the U.S. Department of Energy's Better Buildings Initiative. That share makes multifamily a primary target for municipal and state energy efficiency mandates. Properties that cannot document their energy and water consumption through recognized benchmarking tools — primarily the EPA's ENERGY STAR Portfolio Manager — face growing friction in regulatory filings, lender due diligence, and investor reporting.
Properties certified under ENERGY STAR or LEED typically operate with utility expenses approximately 20% lower than non-certified buildings of comparable size and age, according to Verdant's 2026 multifamily energy efficiency analysis. The certification process requires establishing a consumption baseline, which is the same data infrastructure needed for ongoing utility management — making the two investments complementary rather than redundant.
Mandatory Benchmarking Is Expanding
Cities, states, and municipalities across the United States have enacted utility benchmarking ordinances requiring building owners to track and report annual energy and water consumption. New Jersey expanded mandatory benchmarking requirements for commercial and multifamily buildings in 2026. New York City's Local Law 97 building energy performance standards and Local Law 88 submetering requirements create compounding compliance obligations for covered multifamily properties in that market. The trend toward mandatory reporting is national, not regional.
Comprehensive energy management systems — covering analytics, controls, and real-time monitoring — deliver median energy savings of 11 to 22% in multifamily buildings, according to the DOE Better Buildings Initiative's benchmarking of participating properties. These systems generate the consumption data required for benchmarking compliance as a byproduct of their operational function, meaning operators who implement them for financial reasons receive the compliance infrastructure as part of the same investment.
What This Means for Operators in 2026
The Gap Between Reactive and Proactive Operators Is Widening
The data describes two very different operating positions entering the second half of 2026. Reactive operators are absorbing every rate increase in real time, running stale lease addenda, performing no vacant cost recovery, and catching billing errors only when residents dispute them. Proactive operators have metered properties, run automated billing with audit trails, perform VCR as a standard workflow, and review rate structures annually as part of asset management. The financial distance between these two positions compounds each billing cycle.
With $18.6 billion in rate increases in the pipeline, a five-year backdrop of 47 to 103% increases depending on utility type, and 30-plus state legislative changes affecting billing methodology and disclosure requirements in the past 18 months, the cost of the reactive position has never been higher. The utility management decisions operators make in 2026 will determine property-level NOI for the next three to five years.
How Billee Supports the Transition
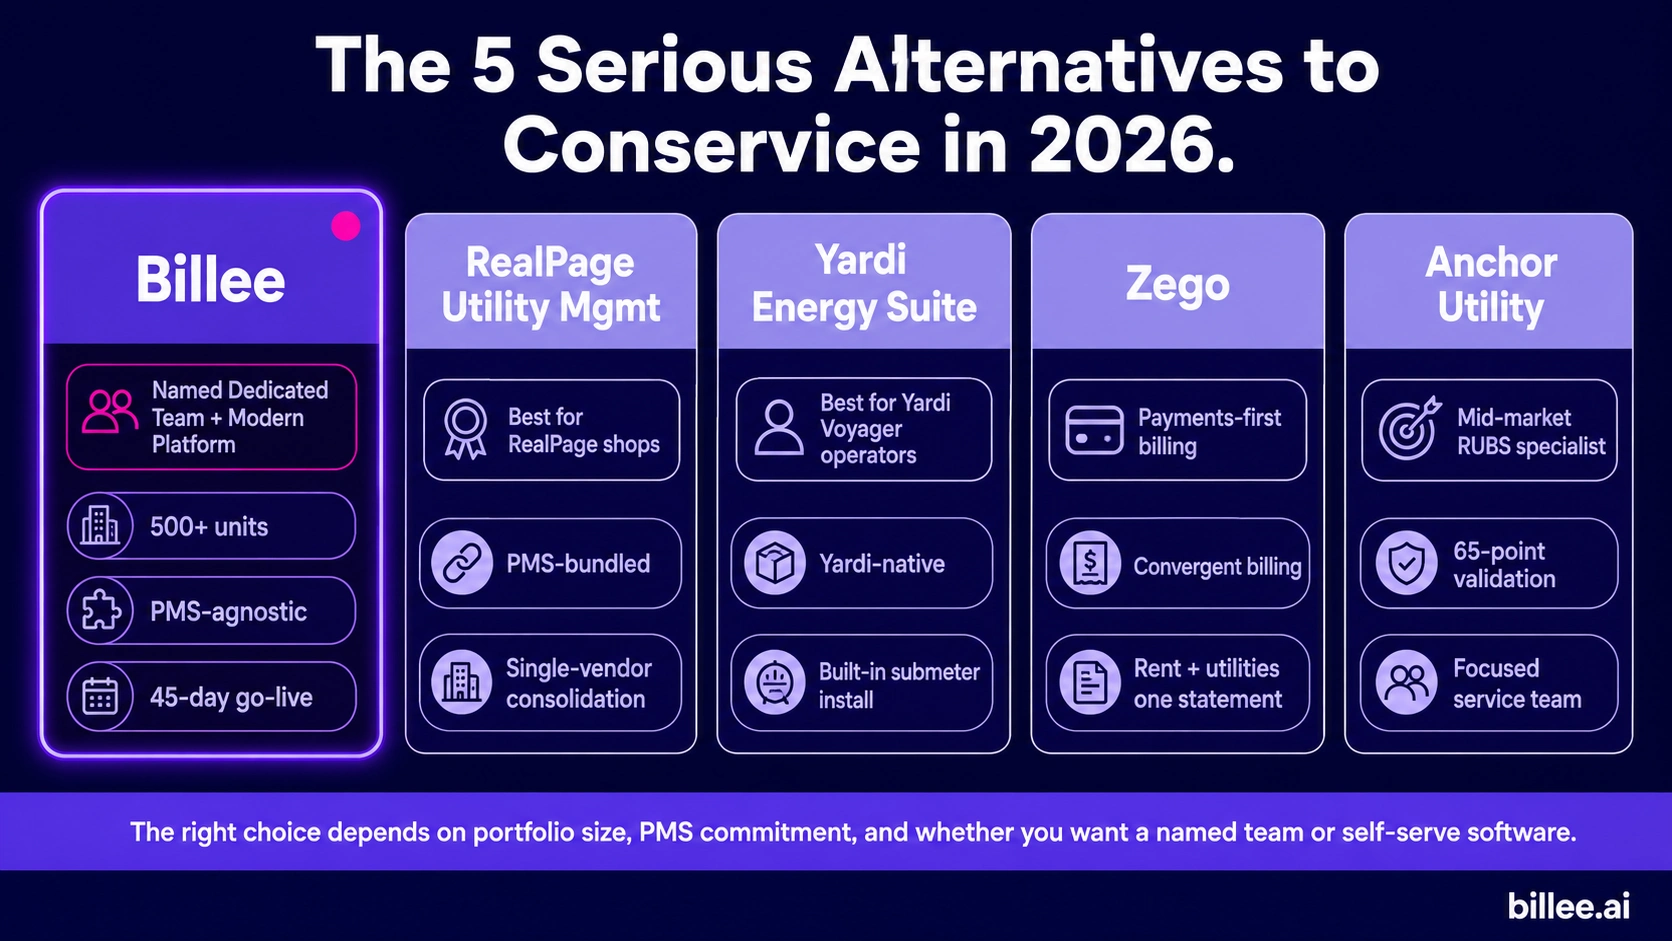
Billee's full-service utility management model handles billing execution, vacant cost recovery, methodology audits, and regulatory compliance tracking — the full stack of functions that determine whether a property closes the gap between what it absorbs and what it recovers. Billee's Regulatory and Compliance product monitors state-level legislative changes and flags when lease addenda require updates before the next renewal cycle, addressing the compliance drift that affects every portfolio operating across multiple states. See how a billing methodology audit works and what documentation it produces for lender and investor due diligence. Implementation goes live in 45 days.
Frequently Asked Questions
What is the average utility cost per unit in multifamily housing in 2026?
The most recent comprehensive benchmark is $1,304 per unit per year from the National Apartment Association's 2024 Income/Expense IQ report, covering more than 4,600 properties and 1 million units. That figure understates what operators are facing in 2026, given that U.S. utilities filed $18.6 billion in rate increase requests in the first half of 2026 alone. The actual per-unit cost in 2026 will vary by market, utility type mix, and how much is owner-absorbed versus resident-billed.
By how much have utility costs increased since 2020?
Electricity increased approximately 47% between 2020 and 2025, per U.S. Energy Information Administration data. Natural gas increased approximately 103% over the same period. Water and sewer costs increased approximately 59%. These five-year increases reflect structural cost drivers — grid infrastructure investment, pipeline capacity, and water system compliance requirements — that are not reversing in the near term.
What is the difference in cost recovery between RUBS and submetering?
Submetered water programs targeting best-practice performance achieve 85 to 95% recovery of the master meter bill. Submetered electricity programs should reach 95% or higher. RUBS programs typically recover 70 to 85% after common area exclusions and allocation methodology constraints. In-rent and flat-rate billing recover 0% of variable cost increases. The NAA case study of a 450-unit retrofit found that water submetering alone generated $180,000 in NOI improvement, with electricity submetering adding $276,000 — producing a $5.5 million valuation increase at a 5% cap rate.
How much water do residents save when they pay their own utility bills?
The NAA/NMHC water conservation study, examining 32 properties across California, Texas, and Florida, found that residents who pay for water consume up to 39% less than residents whose water costs are included in rent. Median submetered properties used 18 to 39% less water than in-rent properties. A Guidehouse study of 1,500 submetered units found a 40% reduction in monthly electricity use per unit in the first year of submetering. The conservation effect is behavioral and immediate — it does not require capital improvements.
What is vacant cost recovery (VCR) and how much are operators losing without it?
Vacant cost recovery is the process of billing residents for utility consumption during the period between move-in and when they transfer the utility account into their name. Approximately 1 in 4 residents delays this transfer. Industry surveys estimate that operators absorb an average of $40,000 per year in utility costs that should be recovered from residents, with vacant account gaps as a primary driver. Approximately half of multifamily operators do not actively perform VCR, leaving this recovery opportunity uncaptured on every renewal cycle.
What percentage of multifamily operators are using AI in 2026?
94% of multifamily operators are implementing AI or planning to within 12 months, according to EliseAI's 2026 executive survey as cited in Frontdesk Research's State of AI in Multifamily Housing report. Among those with active AI deployments, 77% report reduced operating expenses and 85% report improved lead-to-lease conversion. In utility management specifically, AI applications include automated invoice auditing, usage anomaly detection, and portfolio-level expense monitoring.
What do residents want to know about utility billing before signing a lease?
The SatisFacts 2025 Biennial Online Renter Study found that "utility billing practices and usage charges" ranked third in what residents expect landlords to be transparent about, at 64.8% of respondents. "Mandatory fees beyond the advertised rent" ranked first at 83.3%. In 2025, 56.4% of residents said unclear or unexpected fees would prompt a negative review — the highest-rated negative review trigger of any reason tested. Residents want to see the total monthly cost up front, with the billing methodology explained before they sign.
What is the energy footprint of multifamily housing in the United States?
Multifamily buildings account for an estimated 23% of U.S. residential energy consumption, according to the DOE Better Buildings Initiative. That share makes multifamily a primary target for state and municipal energy benchmarking and performance mandates. ENERGY STAR and LEED certified multifamily properties typically operate with utility expenses approximately 20% lower than comparable non-certified buildings. Mandatory benchmarking requirements are expanding in 2026, with cities and states across the country requiring annual energy and water consumption reporting through EPA ENERGY STAR Portfolio Manager.
Billee's full-service utility management platform handles billing, vacant cost recovery, methodology audits, and compliance tracking — with implementation in 45 days. Talk to the team.
Sources
1. National Apartment Association, "From Momentum to Management: Navigating Elevated Costs in a Constrained Operating Environment," 2024 Income/Expense IQ (IREM/BOMA), accessed 2026.
2. PowerLines, "Utilities Request $18.6 Billion in Rate Increases in First Half of 2026," July 14, 2026.
3. Conduit Labs, "HUD FY 2026 Utility Allowance Factors: What Changed," March 1, 2026.
4. National Apartment Association, "Improving Returns and ESG Metrics Through Multifamily Submetering," accessed 2026. (Cites Guidehouse/Navigant study: 1,500-unit electricity submetering analysis; Metergy Solutions 450-unit case study.)
5. NAA/NMHC (Industrial Economics, Inc.), "Submetering, RUBS, and Water Conservation," prepared for National Apartment Association and National Multi Housing Council, June 1999. Available via Utility Management and Conservation Association.
6. SatisFacts Research, "The Price You See: Why Fee Transparency Is a 2026 Must-Fix," Biennial Online Renter Study, November 10, 2025.
7. Frontdesk Research, "2026 State of AI in Multifamily Housing," citing EliseAI 2026 Multifamily Executive Survey, published January 15, 2026; updated April 20, 2026.
8. Anchor Utility, "2026 Utility Management Trends in Multifamily," January 9, 2026.
9. Verdant (Copeland), "A Complete Guide: Multifamily Energy Efficiency 2026," accessed 2026.
10. U.S. Department of Energy Better Buildings Initiative, "Multifamily Sector Overview," accessed 2026.
11. U.S. Energy Information Administration, "U.S. electricity prices continue steady increase," accessed 2026.
12. Synergy Utility Billing, "Submetering Benchmarks for 2026," accessed 2026.
13. LeakSense, "What Is Smart Water Metering? A 2026 Guide for Multifamily," 2026.
14. Livable, "How Utility Billing Impacts NOI (A Simple Explanation)," February 17, 2026.
15. Center for American Progress, "Electric and Natural Gas Utility Rate Hikes Tracker," accessed 2026.
16. HUD User, "HUD Multifamily Utility Allowance Factors Data," accessed 2026.
Insights and Industry Trends


Explore more insights