
The Real Cost of Uncalibrated Meters: Billing Errors, Disputes, and Lost NOI

Uncalibrated meters cost money in two directions at once. An under-registering meter quietly loses revenue that never shows up on anyone's radar. An over-registering meter creates a resident-facing bill that is wrong in the other direction, the kind that generates complaints, disputes, and occasionally lawsuits. This article puts numbers on both, and is honest about where the public record is thin.
Key Takeaways
- Uncalibrated meters create exposure in two opposite directions: under-billing, which is invisible lost revenue, and over-billing, which is visible dispute and legal risk. Most operators only actively watch for one.
- A worked example later in this article shows the dollar gap between Billee's healthy 80-95% recovery range and a degraded 75% rate on a representative 500-unit portfolio, using a cited industry range for average monthly utility cost per unit.
- That recovered revenue compounds into property value under standard real estate math (Value = NOI divided by Cap Rate). At a representative cap rate, a six-figure annual recovery gap can translate into a seven-figure valuation gap.
- Most publicly documented multifamily billing disputes in 2025 and 2026, including a Los Angeles rent strike against Equity Residential and ongoing litigation against Conservice, are about RUBS methodology and transparency, not meter hardware accuracy specifically.
- The Los Angeles case shows dispute costs at real scale: a 140-unit building, 43 or more units on rent strike, and a $25,000 refund, with the underlying consumption spike partly traced to undetected leaking fixtures, a physical root cause even though the dispute itself centered on billing transparency.
- Conservice's ongoing 2026 litigation illustrates provider-level scale risk, with estimated, not yet finalized, per-resident payouts in the hundreds to low thousands of dollars.
- Hardware-specific disputes are harder to find in public records than methodology disputes. That gap reflects visibility, not actual risk.
Two Kinds of Cost, Pointed in Opposite Directions
Under-billing: the invisible leak
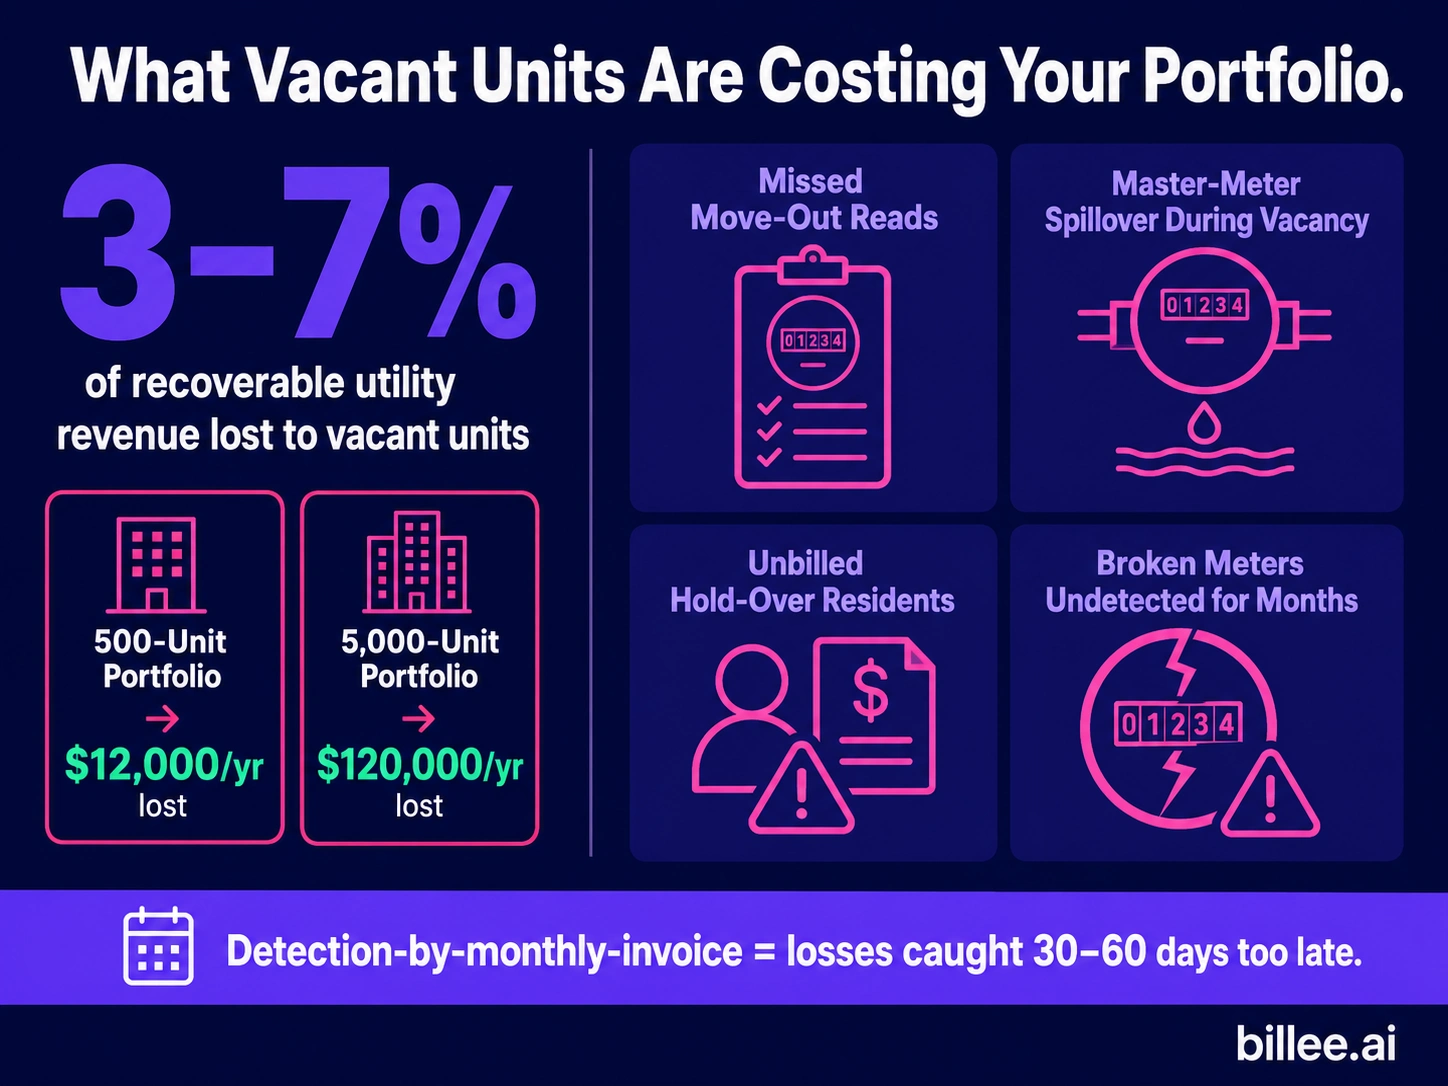
Billee's companion piece on what calibration means walks through the basic math: even a 2% inaccuracy across a 500-unit property can translate into thousands of dollars in misallocated or lost revenue annually. That math understates the real exposure, because a single under-registering meter rarely stays at a small, steady error. Drift compounds over months or years of uncorrected operation, and a portfolio with no testing cadence has no way of knowing how many meters have quietly drifted past that starting 2%.
Over-billing: the visible risk
Over-billing works differently. A resident who receives a bill meaningfully higher than their actual usage notices immediately, and that complaint does not stay contained to one unit. It becomes a pattern other residents compare notes on, a data point in a renewal decision, and in the cases covered later in this article, the basis for organized rent strikes and litigation.
Under-billing costs an operator money nobody sees. Over-billing costs an operator money everybody sees.
Modeling the NOI Impact
A worked recovery-rate example
Billee's own benchmark treats an 80-95% recovery rate as healthy performance and flags anything below that range for review. Consider a representative 500-unit portfolio with average monthly utility costs of $200 per unit, a figure within the commonly cited $150 to $300 per-unit range for apartment utility costs. That portfolio has roughly $1.2 million in billable annual utility revenue.
At a 90% recovery rate, the portfolio recovers $1.08 million and loses $120,000 annually to unrecovered charges. At a degraded 75% recovery rate, driven in part by undetected meter drift, the portfolio recovers only $900,000, a loss of $300,000. The gap between healthy and degraded performance here is $180,000 a year, money that never appears as a line-item loss anywhere, just as revenue that was never billed in the first place.
From NOI to property value
That $180,000 does not stay a one-year number. Under the standard real estate valuation formula, Value equals Net Operating Income divided by Cap Rate. At a representative 6% market cap rate, the same rate used in a published industry worked example on utility billing's effect on multifamily valuation, an additional $180,000 in annual NOI adds roughly $3 million in property value.
That number depends entirely on the actual cap rate and cost assumptions for a specific property, and it is presented here as an illustration of the mechanism, not a promise about any particular portfolio. The mechanism itself, however, is standard, uncontested real estate math: recovered utility revenue is NOI, and NOI drives valuation at whatever multiple the market applies.
What Billing Disputes Actually Cost When They Go Public
The 2025 Los Angeles rent strike
In 2025, residents at a 140-unit Los Angeles building owned by Equity Residential organized a rent strike over RUBS utility billing they said was opaque. The dispute was not about meter accuracy. Residents wanted a detailed breakdown of the underlying utility costs, disclosure of the calculation formula, and access to the actual city utility bills the RUBS allocation was based on. Management ultimately issued $25,000 in total refunds, with individual residents receiving credits as high as $700.
What makes this case relevant to a hardware-focused article is a detail buried in management's own explanation. The company attributed part of the billing issue to leaking toilet flappers and fill valves, a physical, consumption-driving problem, while telling residents that calculating its exact impact was "difficult and impracticable." A RUBS dispute over transparency and a hardware or maintenance issue distorting actual consumption are not the same problem, but they are not unrelated either. An undetected physical issue inflated real usage, and an opaque allocation system made that inflation impossible for residents to trace or dispute effectively until they organized.
The 2026 Conservice litigation
Conservice, one of the largest third-party utility billing providers serving multifamily properties, is facing ongoing litigation as of mid-2026 over its use of RUBS billing. The allegations center on charging residents more than their actual usage would justify by spreading shared utility costs across all residents rather than billing based on individual consumption, the same methodology-based complaint at the center of the Los Angeles case. As of this writing, settlement figures are projected rather than finalized, with estimates in the range of $30 to $500 or more per affected resident and $1,000 to $5,000 for named plaintiffs, based on comparable prior cases rather than a confirmed court determination.
Why hardware-specific disputes are harder to find
Searching for a multifamily lawsuit specifically about meter calibration or hardware accuracy, rather than billing methodology, turns up very little. The clearest documented example of what an undetected hardware failure actually costs is Houston's 2026 municipal water meter mix-up, covered in this cluster's first piece, where a manufacturing defect went undetected for more than a year and inflated one household's bills from 2,000 to 15,000 gallons a month before discovery. That is a municipal utility case, not a multifamily submetering case, and the scarcity of a closer example is itself worth noting.
It does not mean hardware-driven billing errors carry less risk than methodology disputes. It means they are less visible, since a resident experiencing an inflated bill has no easy way to tell whether the cause is a flawed formula or a faulty meter, and public reporting tends to follow the dispute that is easier to explain.
The Less Visible Costs
Staff time spent investigating and resolving billing disputes is a real cost that rarely gets tracked as its own line item, even though industry commentary consistently names high dispute volume and manual billing processes as recurring drains on operational capacity. Resident trust erosion is harder to quantify but reasonable to connect to renewal decisions, since a resident who has had one bill successfully disputed has a concrete reason to question the next one, even without a specific study establishing the size of that effect. Documentation and audit exposure surfaces again at refinancing or disposition, where a buyer's due diligence process will ask for the same billing methodology and accuracy history that a resident dispute would have already tested.
Where the Cost Shows Up
| Cost Category | Direction | Where It's Visible | Example |
|---|---|---|---|
| Unrecovered revenue from drift | Under-billing | Recovery-rate reporting, not resident complaints | The 90% vs. 75% recovery-rate model above |
| Resident disputes and refunds | Over-billing | Complaints, rent strikes, litigation | The 2025 Los Angeles rent strike |
| Provider-level litigation | Over-billing | Class actions against billing vendors | The 2026 Conservice litigation |
| Undetected hardware failure | Both, depending on drift direction | Rarely visible until discovered, then highly visible | The 2026 Houston meter mix-up |
| Staff time and trust erosion | Both | Operational capacity, renewal decisions | Industry-wide, not case-specific |
Best Practices for Managing This Exposure
Track recovery rate as the leading indicator
Dispute volume is a lagging signal. By the time residents are organizing or filing complaints, the underlying accuracy problem has usually existed for months. Recovery-rate tracking catches the same underlying drift earlier, before it reaches a resident-facing bill.
Model your own portfolio's exposure
Generic industry figures, including the ones in this article, are a starting point, not a substitute for running the actual numbers on a specific portfolio's unit count, average utility cost, and current recovery rate. The math is simple once those inputs are known.
Treat rising disputes as a data signal, not just a service problem
A spike in billing complaints should trigger a root-cause check against both allocation methodology and meter hardware, not just a customer service response. The two problems look similar from a resident's side of the bill and require different fixes.
What to Look for in a Partner
- Recovery-rate tracking as a standard, ongoing report rather than an occasional audit
- The ability to model portfolio-specific NOI and valuation exposure, not just cite generic industry benchmarks
- A documented process for tracing a spike in disputes back to its root cause, whether that is allocation methodology or meter hardware
- Transparent handling of billing methodology itself, since opacity is what turned the Los Angeles situation into an organized dispute rather than a handful of individual complaints
How Billee Supports This
For the fundamentals of what calibration means and why meters drift, see Billee's companion piece, What Is Submeter Calibration and Why It Matters for Billing Accuracy. For a data-driven approach to setting a testing cadence that catches drift before it compounds, see How Often Should Submeters Be Calibrated?
Billee's Billing & Recovery Engine tracks recovery rate against the 80-95% benchmark referenced throughout this article, flagging portfolios that fall short for review. Billee's Regulatory & Compliance product supports the documentation and audit trail that protects an operator when a dispute, or a refinancing due diligence process, asks how a bill was actually calculated.
FAQ
How much revenue can uncalibrated meters actually cost a property? It depends on portfolio size, average utility cost, and how far recovery has drifted from Billee's healthy 80-95% range. The worked example in this article shows a $180,000 annual gap between a 90% and 75% recovery rate on a representative 500-unit portfolio, though actual figures vary by property.
How does utility billing accuracy affect property value? Recovered utility revenue is NOI, and NOI drives property value under the standard formula, Value equals NOI divided by Cap Rate. A sustained improvement in recovery rate can translate into a meaningfully larger increase in property value than the annual dollar figure alone suggests.
What's the difference between under-billing and over-billing risk? Under-billing is invisible lost revenue that shows up only in recovery-rate reporting. Over-billing is visible to residents immediately and creates dispute, reputational, and legal exposure, including the kind of organized rent strikes and litigation covered in this article.
Are most multifamily utility billing lawsuits about meter accuracy or something else? Based on the disputes documented in this research, most are about RUBS billing methodology and transparency rather than meter hardware accuracy specifically. That does not mean hardware-driven billing errors are lower risk, only that they are harder to find in public litigation records.
What did the 2025 Los Angeles utility billing dispute actually involve? Residents at a 140-unit Equity Residential building organized a rent strike over RUBS billing transparency, ultimately receiving $25,000 in total refunds. Management attributed part of the underlying issue to leaking fixtures, a physical consumption problem layered underneath the transparency dispute.
How is the Conservice lawsuit relevant to meter calibration, if at all? The Conservice litigation is about RUBS methodology, not meter calibration directly, but it illustrates the scale of legal exposure a billing provider can face when residents believe they are being charged more than their actual usage justifies, the same underlying resident concern that a hardware-driven over-billing problem would create.
How does recovery rate connect to NOI? Every percentage point of unrecovered utility revenue is a direct NOI loss, since that revenue was never billed or collected. Billee's 80-95% benchmark exists because portfolios below that range are losing a measurable, and often growing, share of otherwise recoverable NOI.
What's a reasonable way to estimate this cost for my own portfolio? Start with unit count and average monthly utility cost per unit to estimate total billable revenue, then apply the gap between current recovery rate and the 80-95% healthy range to see the annual dollar exposure. From there, the cap rate math in this article shows how that annual figure compounds into a property valuation impact.
Every point of recovery rate below Billee's 80-95% benchmark is NOI that never gets recovered, and money that never gets seen is money that never gets valued. Talk to Billee about closing the gap between where your portfolio's recovery rate is and where it should be.
Sources
- Synergy Utility Billing, "How to Increase Your Multifamily Cap Rate"
- Shelterforce, "LA Tenant Strikes Force Landlord to Refund Opaque Utility Fees"
- Lawfold, "Conservice Utility Lawsuit 2026: What Tenants Must Know"
- LeaseRunner, "How Much Average Utilities Cost Apartment? Full Breakdown"
Insights and Industry Trends